Market
Pulse
The Sydney CBD and North Sydney office markets are undergoing notable shifts amid limited new supply and evolving tenant demand. In the CBD, three projects totalling 171,229sqm are under construction, with no additional supply expected until 2030. Vacancy rates remain elevated at 13.8%, while sublease availability has fallen below pre-pandemic levels. North Sydney saw record-high vacancy rates in 2025 following the completion of Victoria Cross Tower, though positive net absorption in H2 signalled recovery. With no new supply until 2029, vacancy rates are expected to decline as demand strengthens.
Market
Dashboard


Sydney
CBD
13.8%
Vacancy Rate
as at Jan-26
21,657
Net Absorption
12 months to Jan-26
0.8%
Rental Growth
A Grade net effective, 12 months to Dec-25
32%-42.5%
Incentives
Indicative range, as at Dec-25
The arrows indicate the direction of Cadigal’s expected change over the next 12 months.
Vacancy Rate
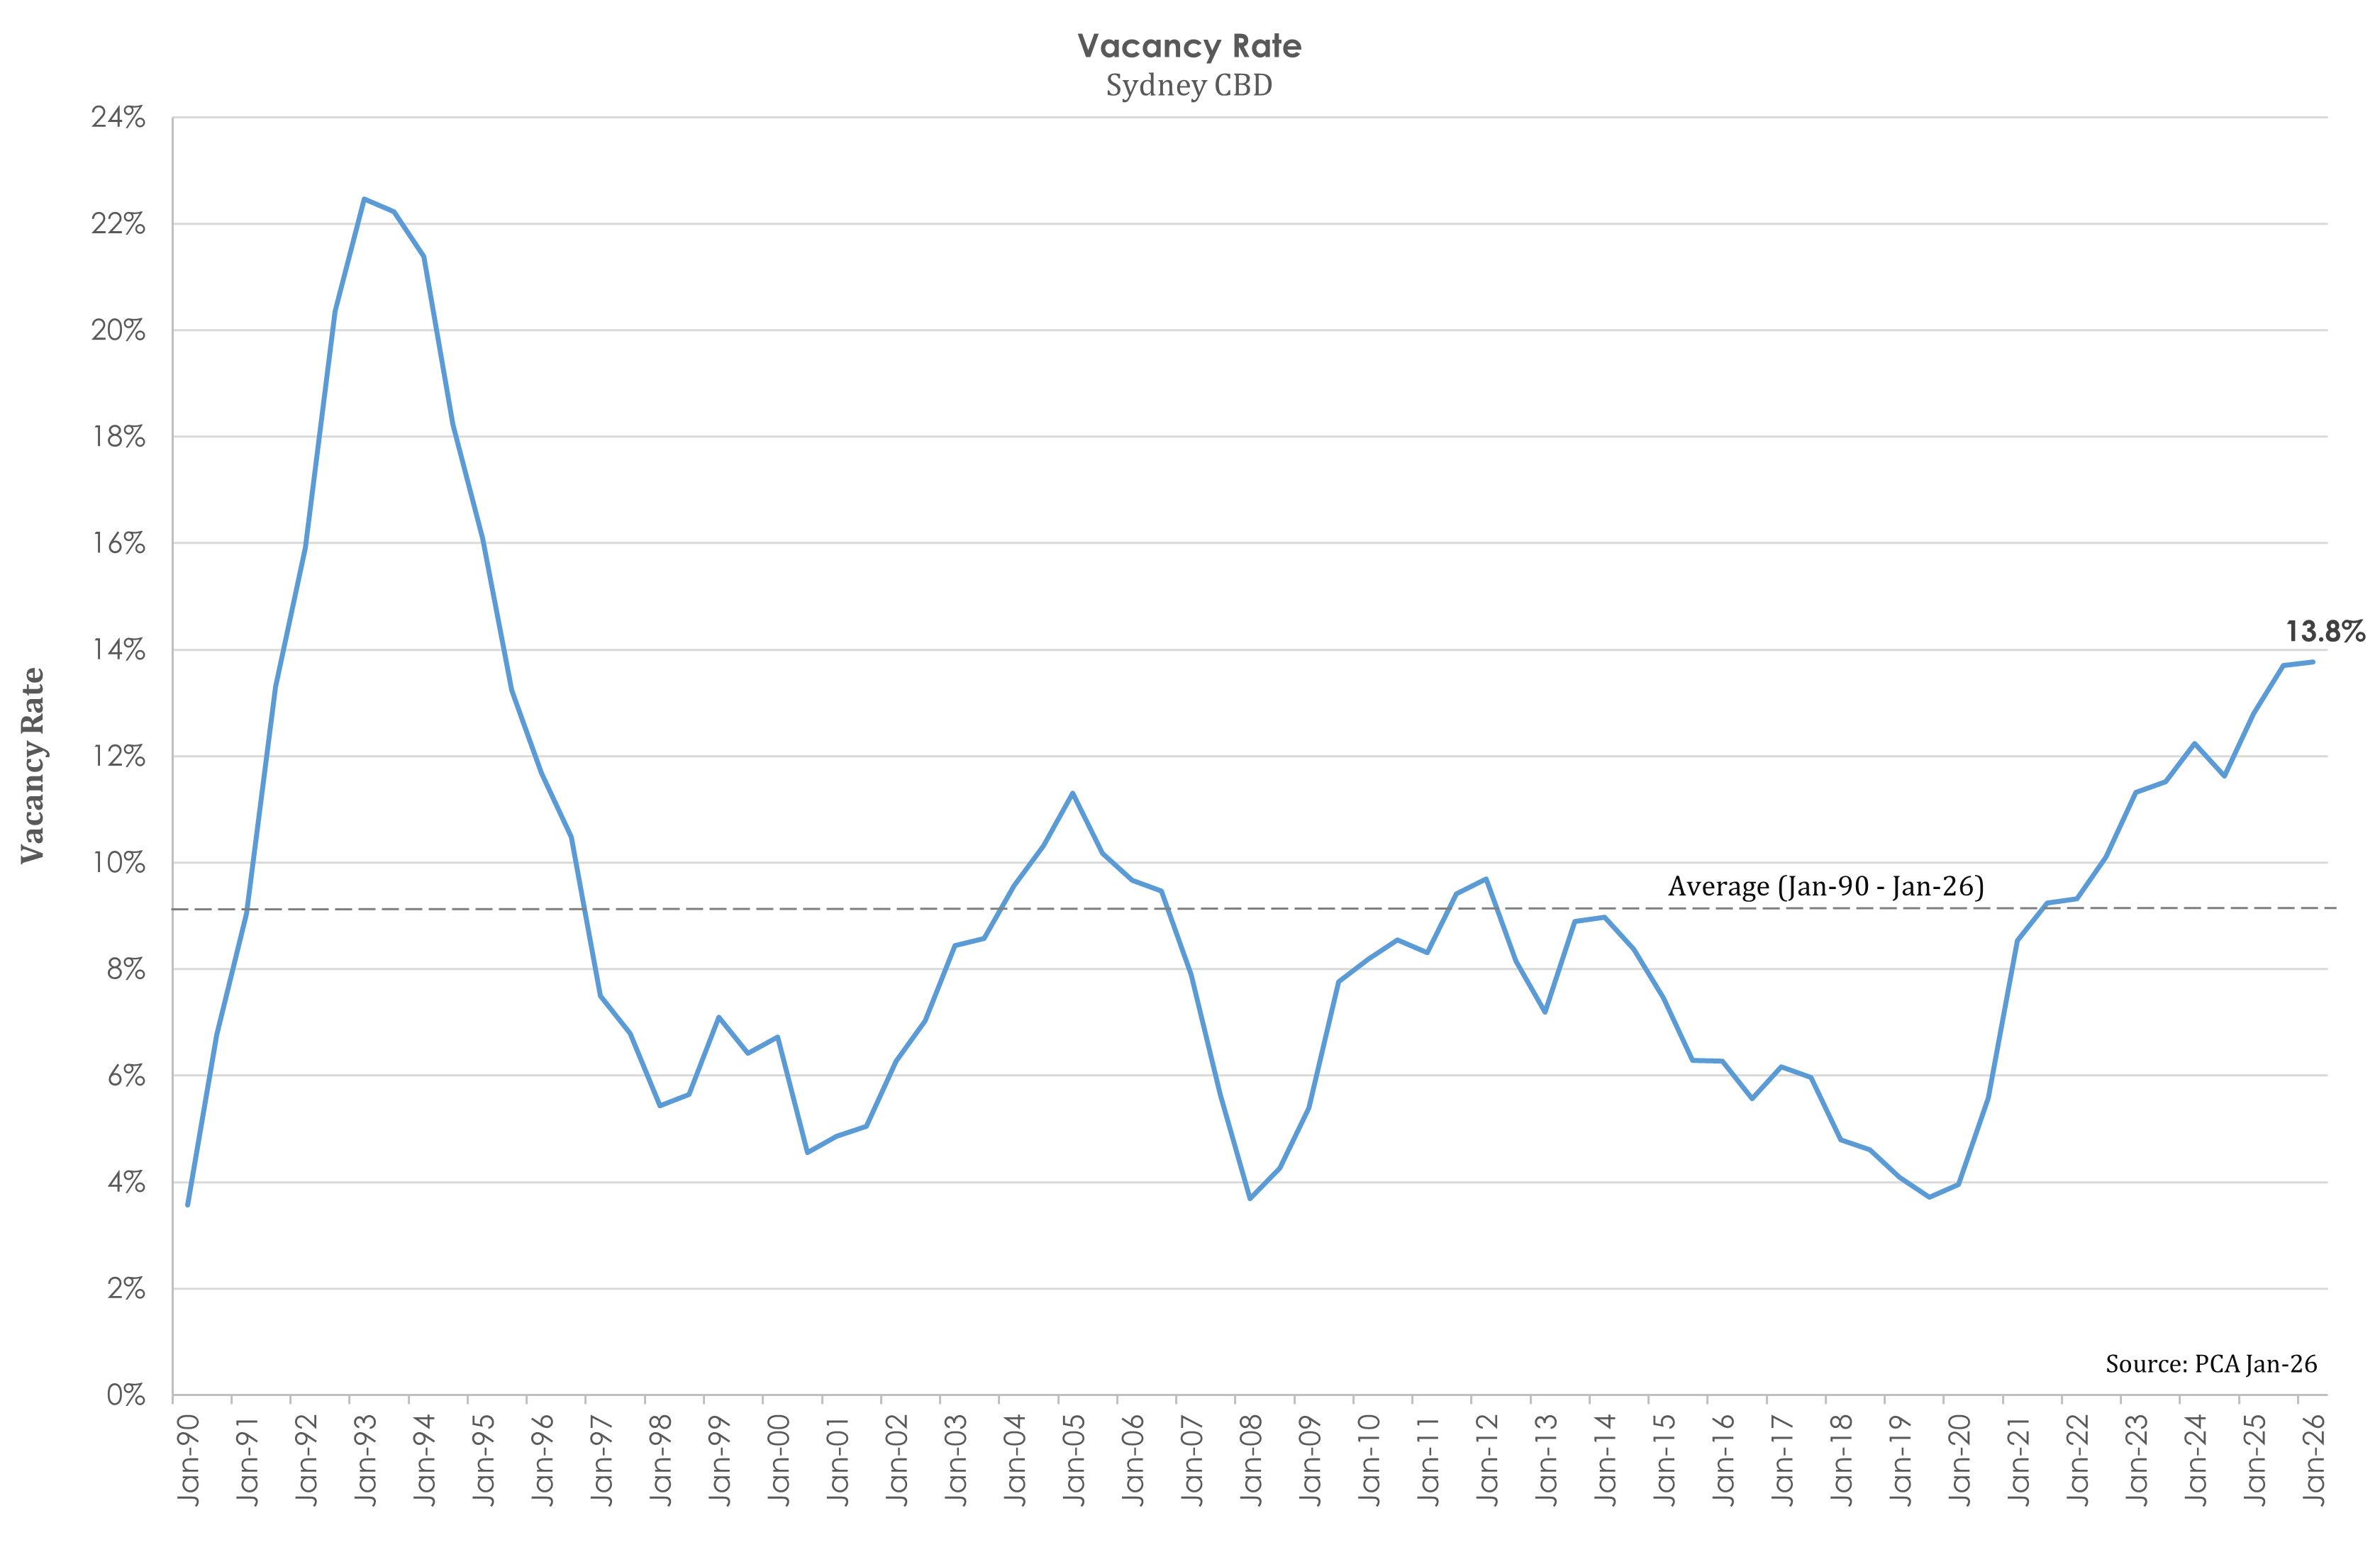
The Sydney CBD vacancy rate tracked sideways over H2 2025, moving from 13.7% to 13.8% in the six months to January 2026. This is the highest vacancy rate the market has seen in 31 years, since January 1995. The result was driven by modest net supply (17,601sqm) not entirely offset by even more modest net absorption (11,359sqm).
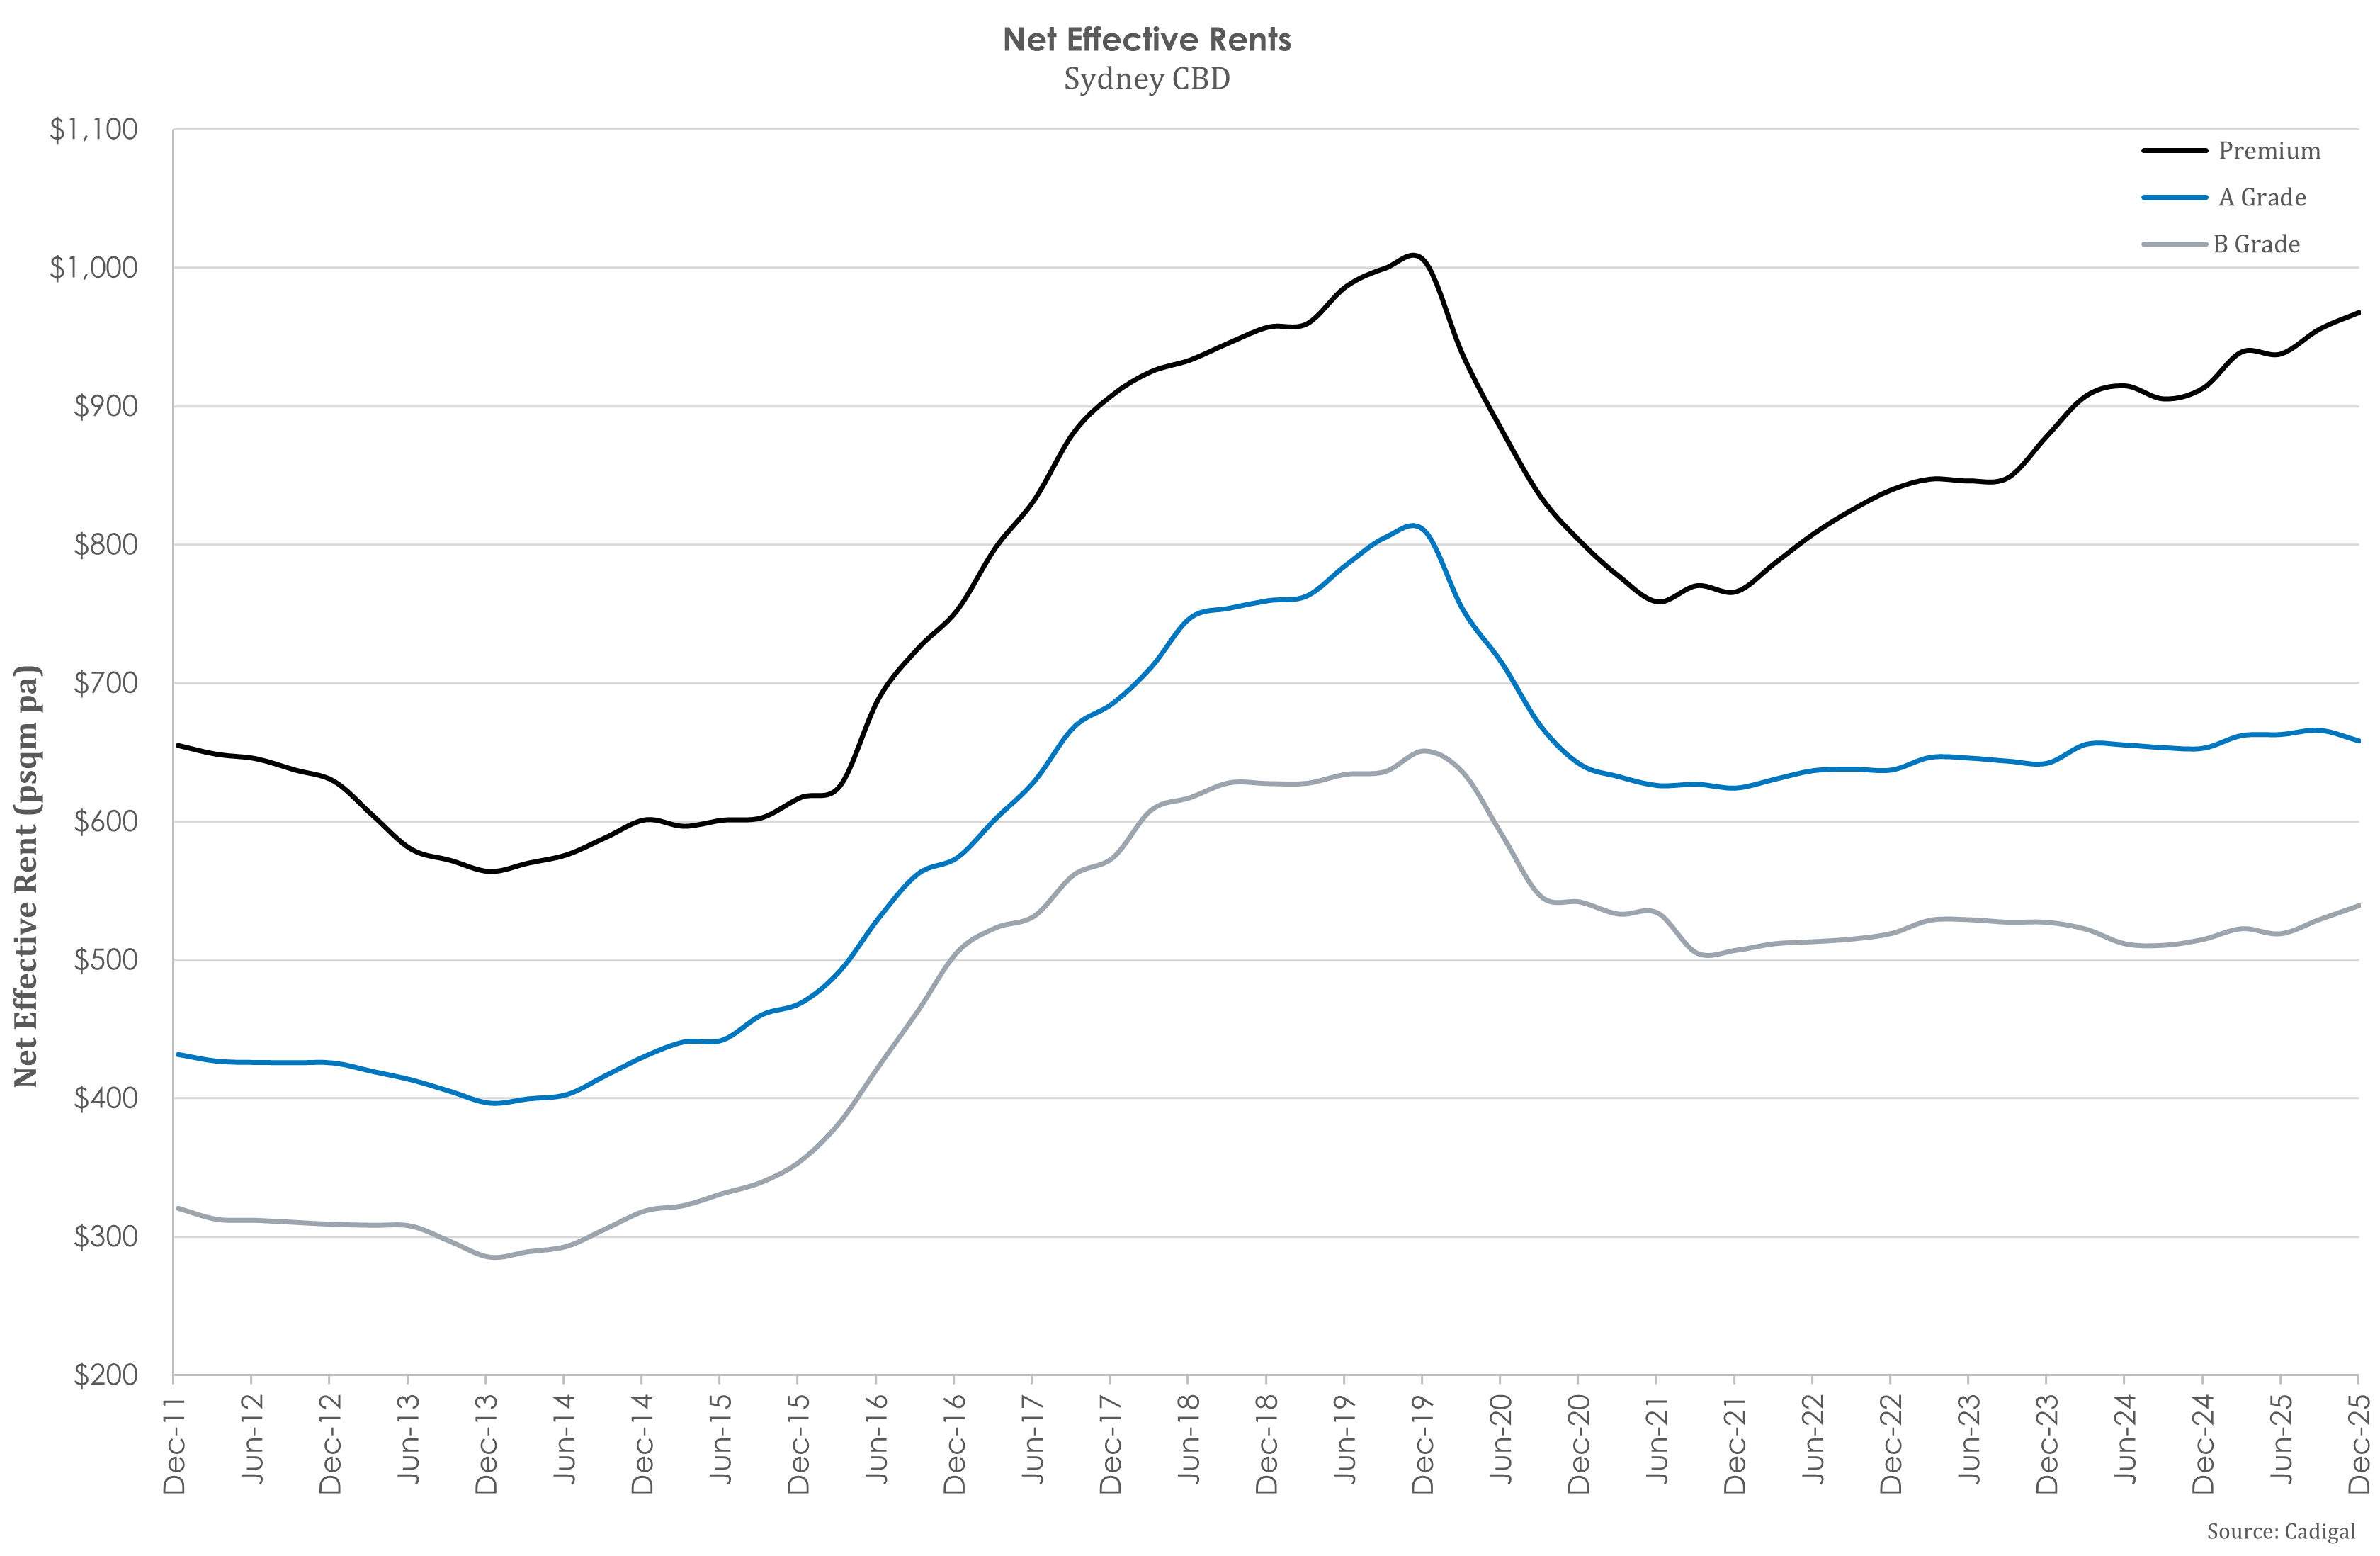
Rents
Face rents in the CBD increased between 3.8% - 6.2% over the 2025 year with A grade lagging the other two investment grades. Premium face rents have grown more than A grade, resulting in a widening of the rental gap (currently 32%) between the two grades. The rental gap on an effective rent basis is even greater (47%) and fast approaching the 14-year high of 52% recorded in Q4, 2012. It is expected that growth in A grade rents will outperform Premium over the near term in response to the widening gap, driven by affordability concerns and availability in Premium space.
Net Absorption
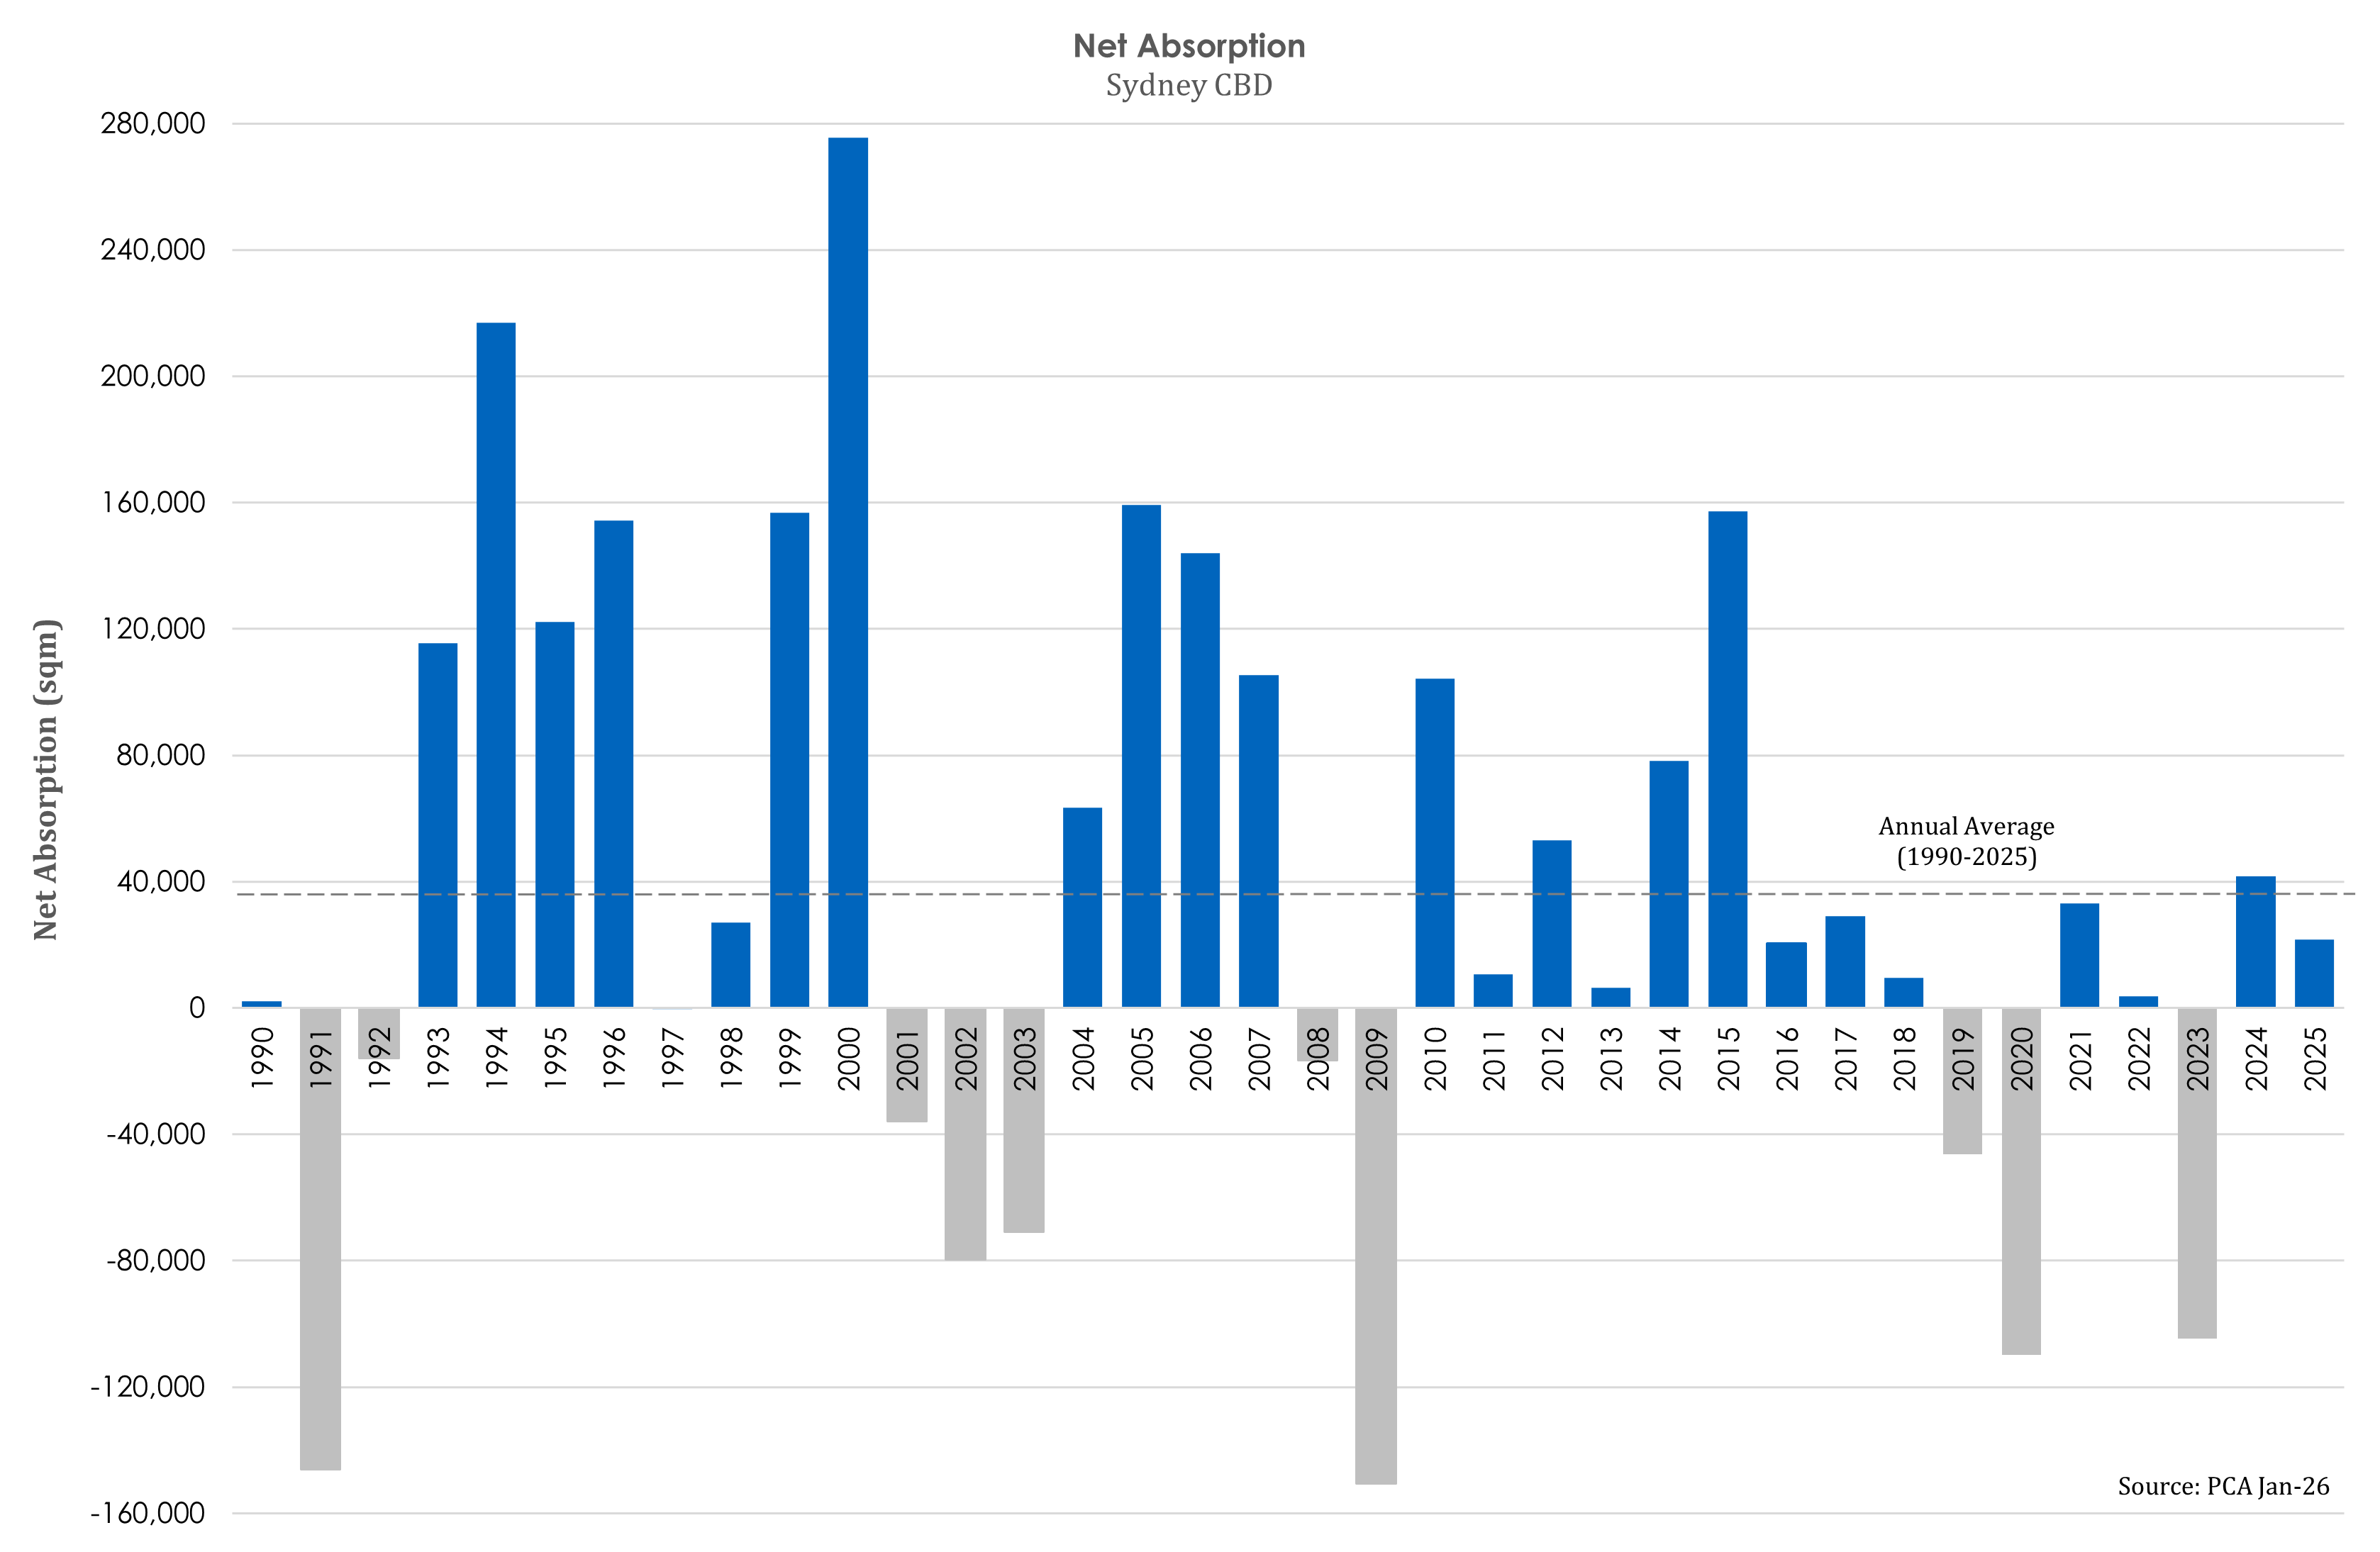
Modest, yet positive, net absorption of 11,359sqm was recorded over H2 2025 after an equally modest tally of 10,298sqm in H1, resulting in the 2025 total (21,657sqm) being just 58% of the long-term average of 37,074sqm. The Core (14,183sqm) and Midtown (5,194sqm) led the CBD precincts for the net absorption over the last 6 months. But we expect Midtown and Western Corridor to outperform in coming periods as tenants seek value in precincts that have more available space.
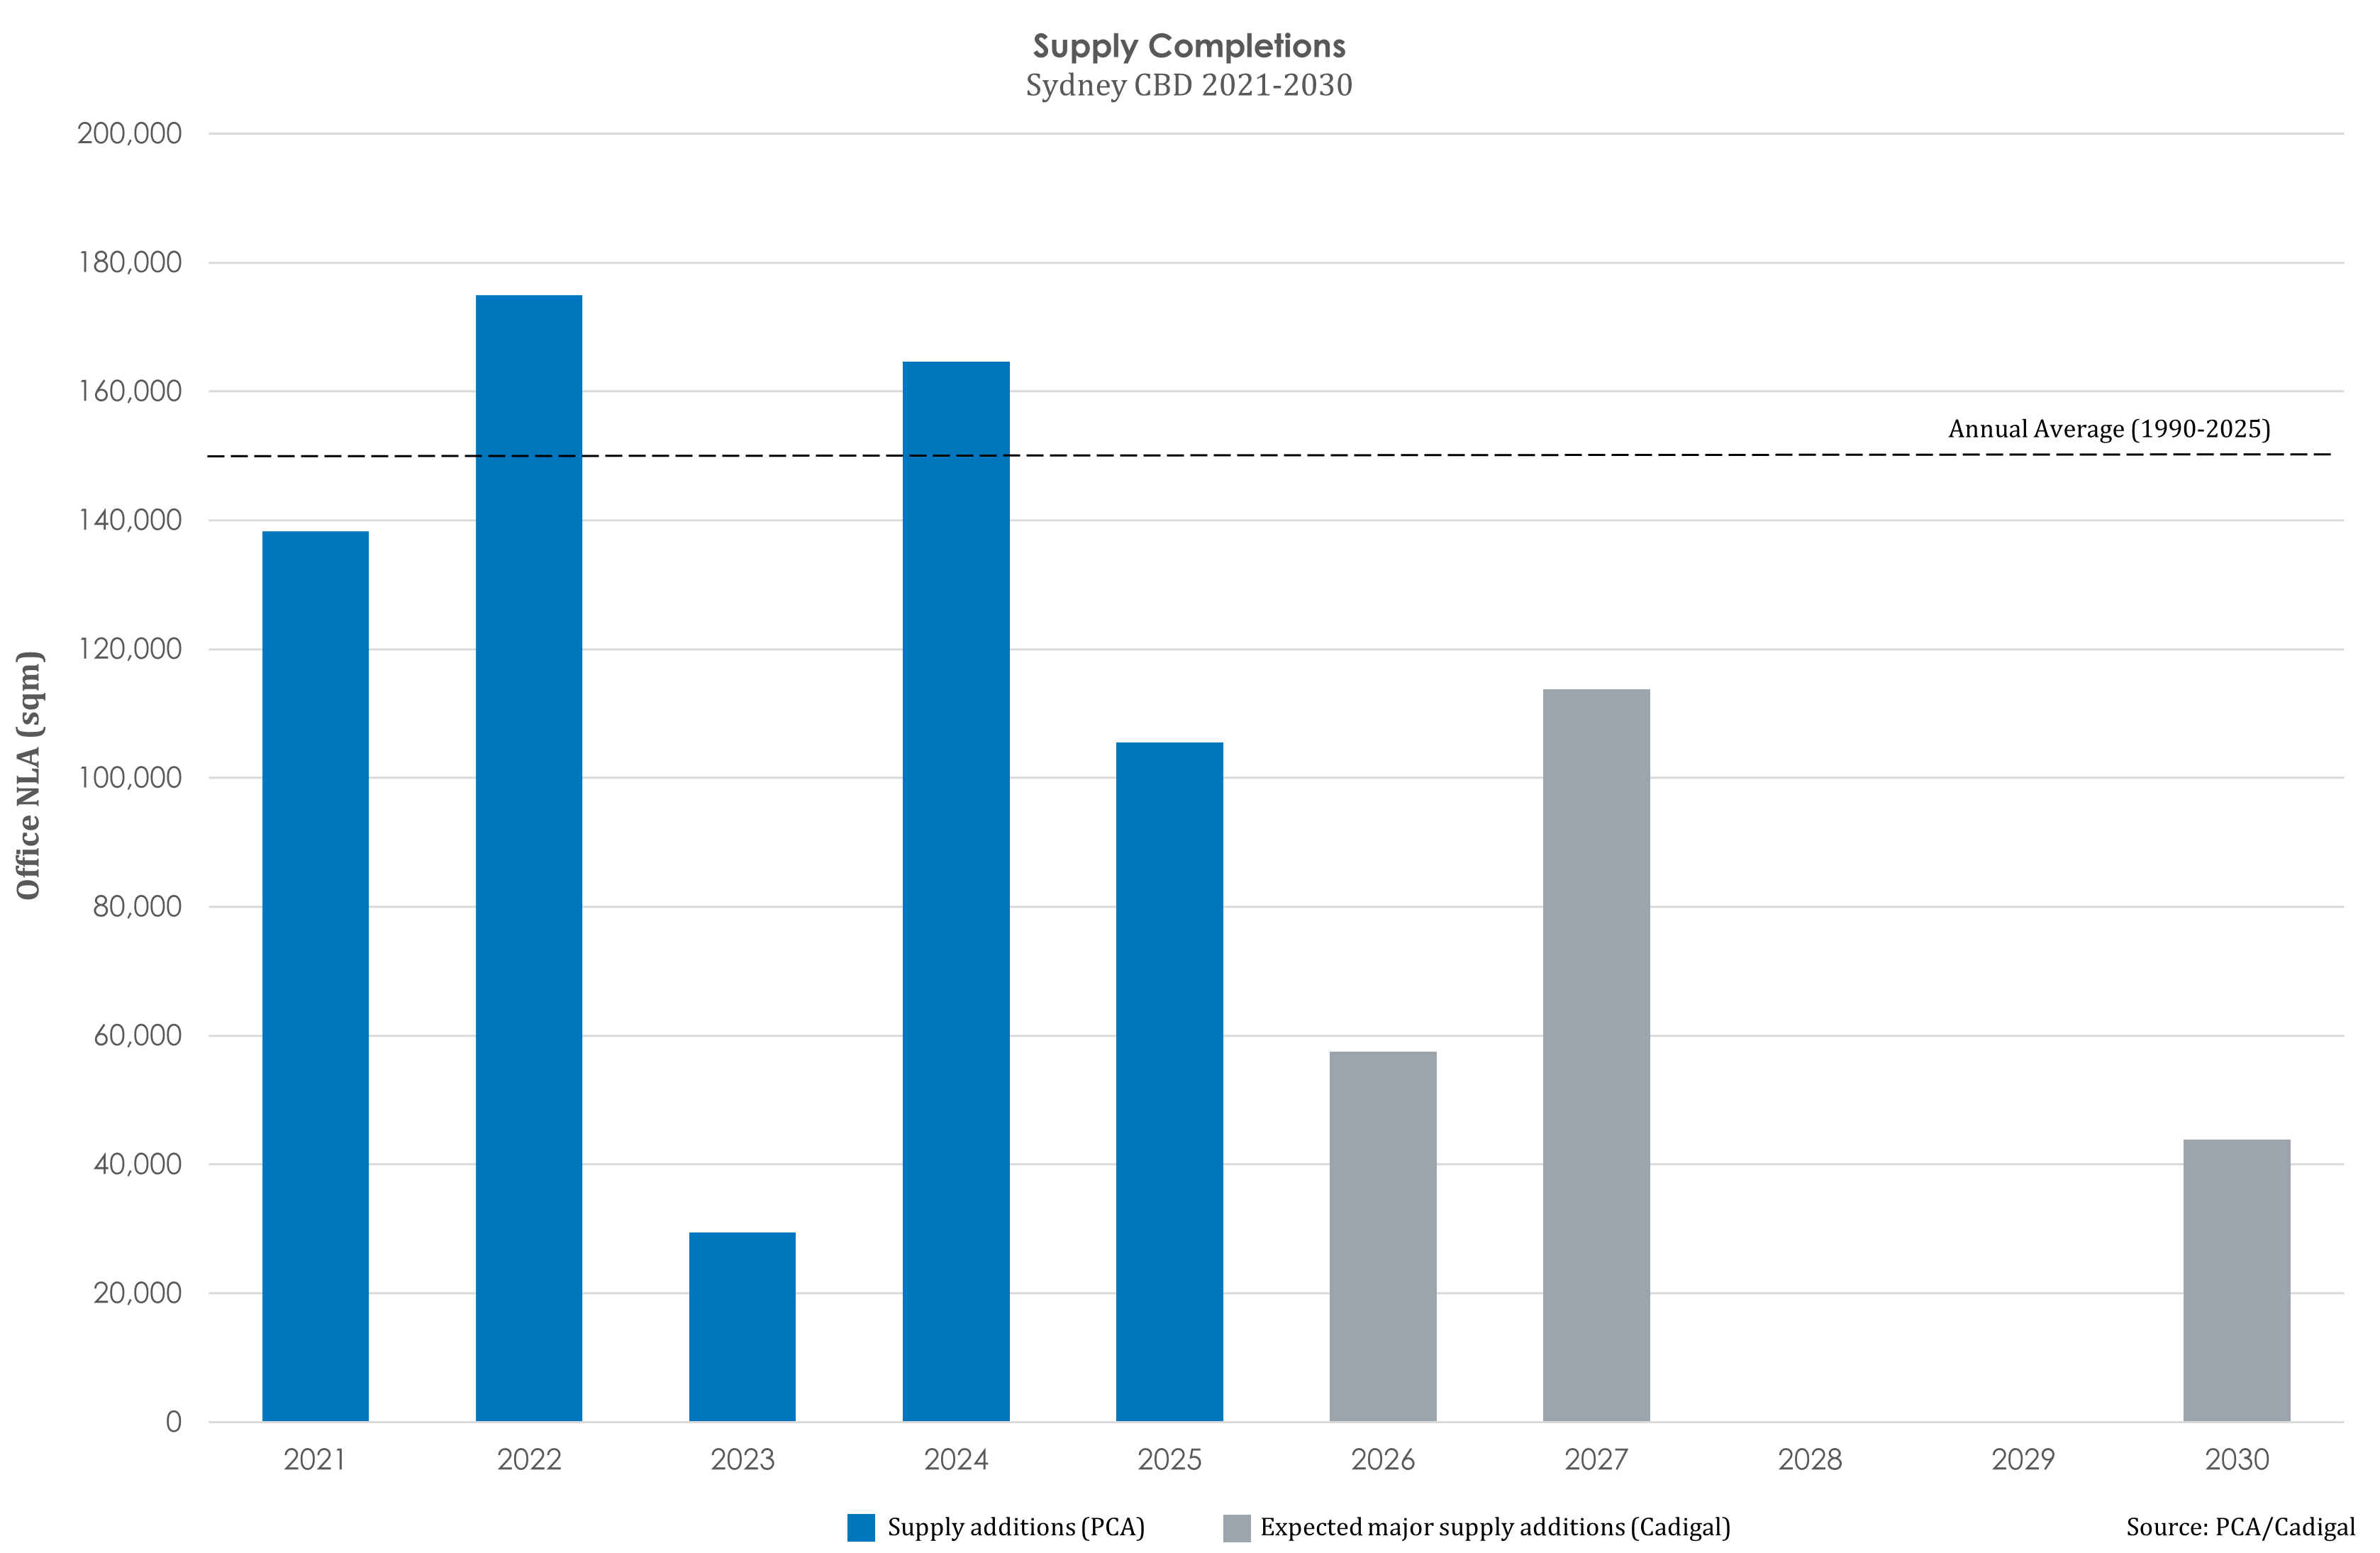
Supply
There is currently 5.39mil sqm of office space in the Sydney CBD, the highest total the market has seen. Whilst no major office projects (new or full refurbishments) were completed in Q4 2025, there were three supply additions over the year, beginning with 121 Castlereagh Street (11,503sqm of office NLA) in Q1, followed by the Premium-grade 33 Alfred Street (31,247sqm) over Q2 followed by 270 Pitt Street (22,669sqm) in Q3.
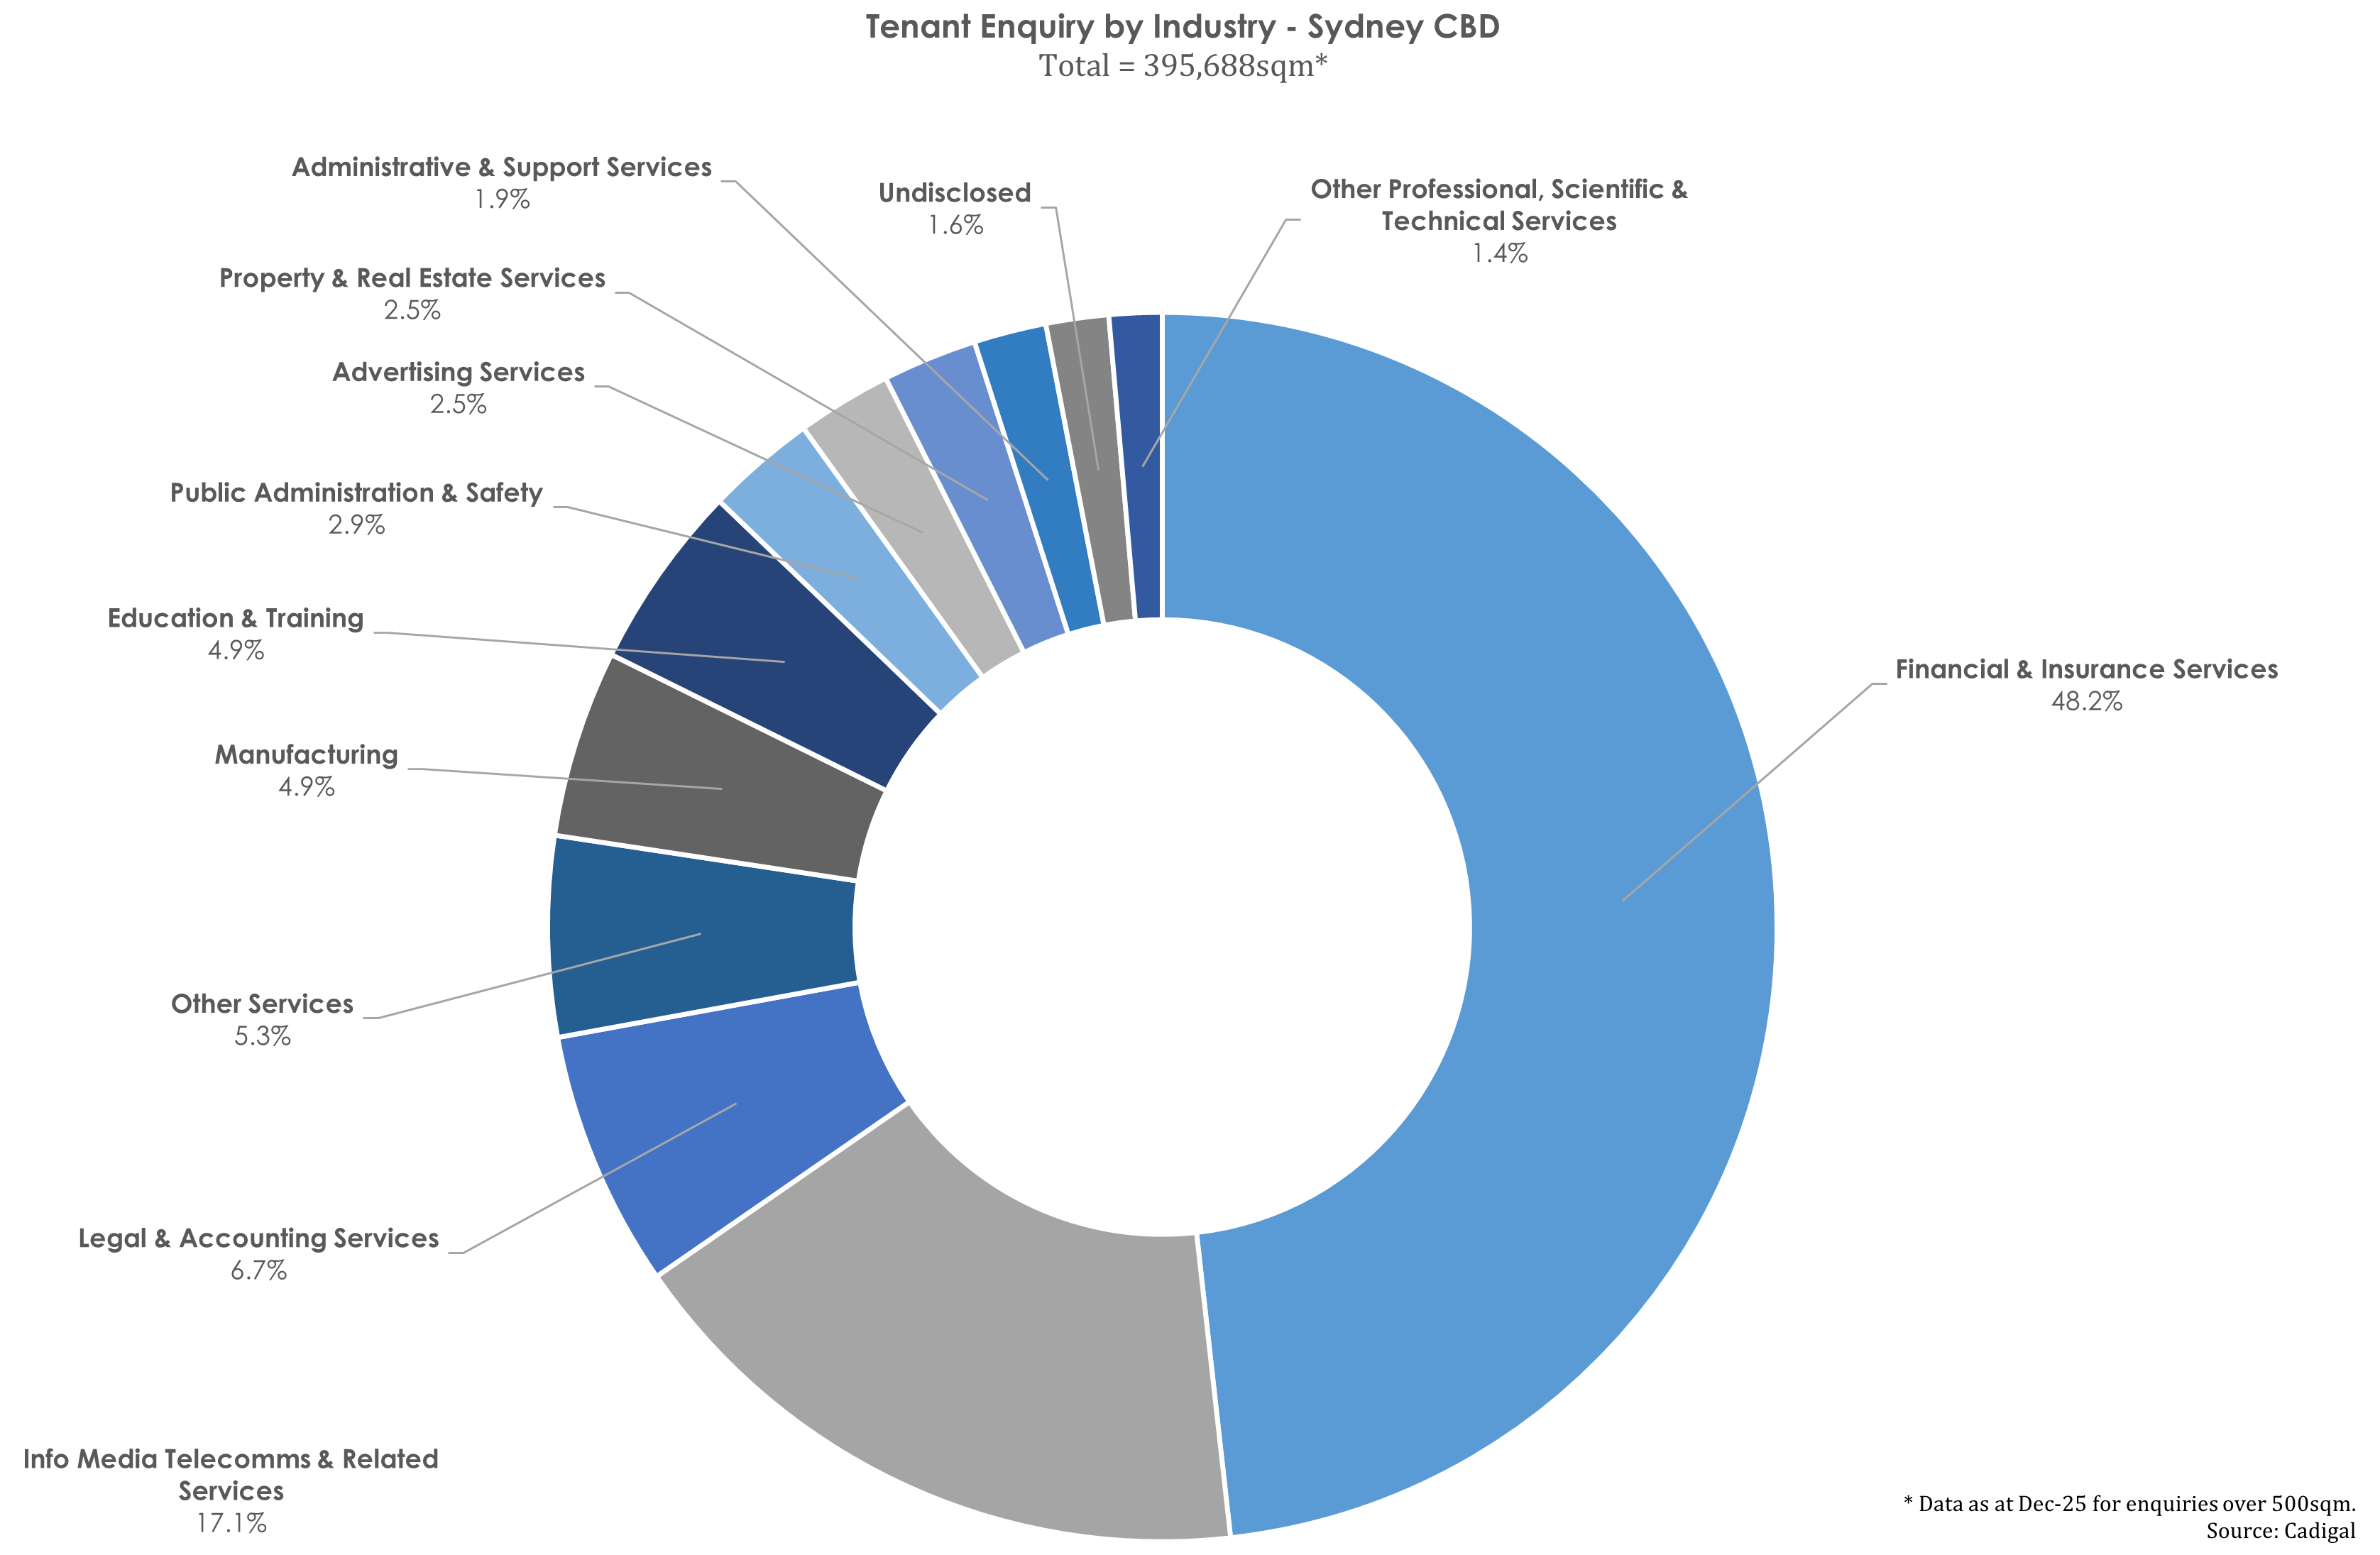
Tenant Enquiry
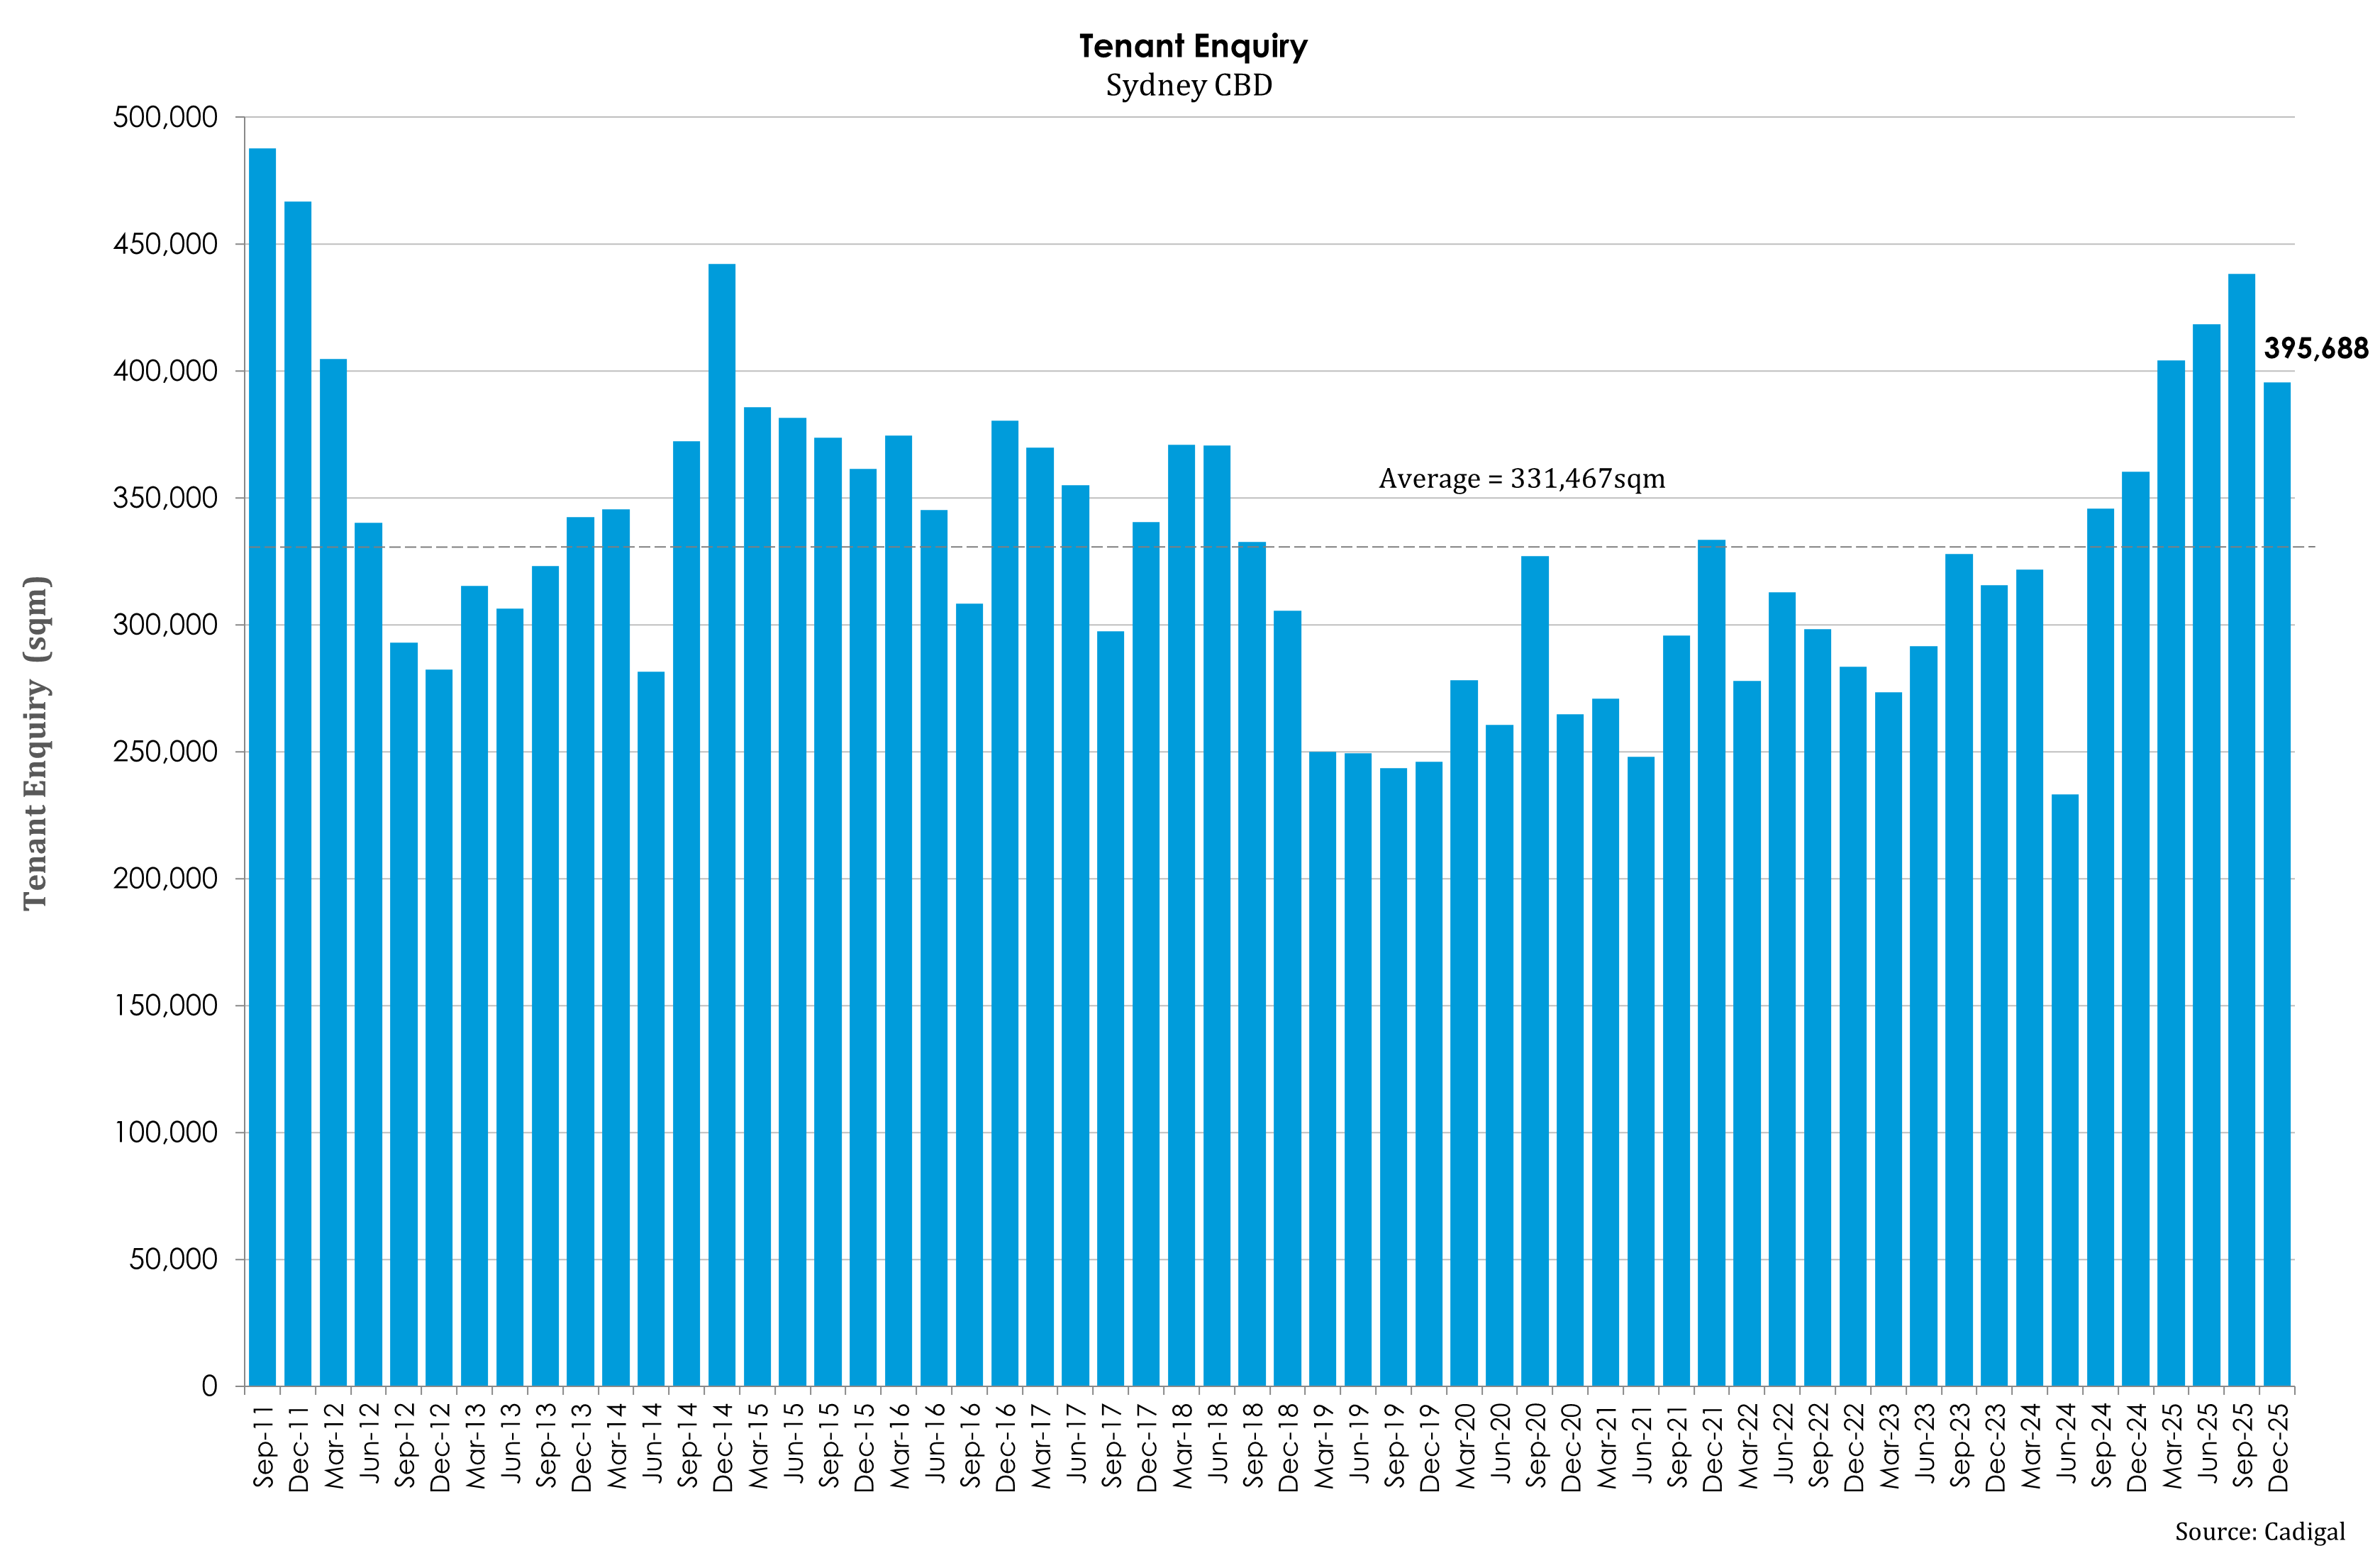
There was 395,688sqm of active tenant enquiry for the CBD as at December 2025, down 10% on the previous quarter. Whilst this volume of enquiry is above the 14-year average (331,467sqm), it has been propped up by an extraordinarily large Westpac enquiry (120,000-150,000sqm) that emerged in the September 2024 quarter. Without the Westpac requirement, overall active tenant enquiry has been weak and has remained substantially below the long-term average since June, 2024.
Enquiry by Industry
North
Shore
25.9%
Vacancy Rate
North Sydney, as at Jan-26
-1,246
Net Absorption
North Shore, 12 months to Jan-26
-3.2%
Rental Growth
North Sydney A Grade net effective, 12 months to Dec-25
38%-47%
Incentives
North Shore indicative range, as at Dec-25
The arrows indicate the direction of Cadigal’s expected change over the next 12 months.
Vacancy Rate
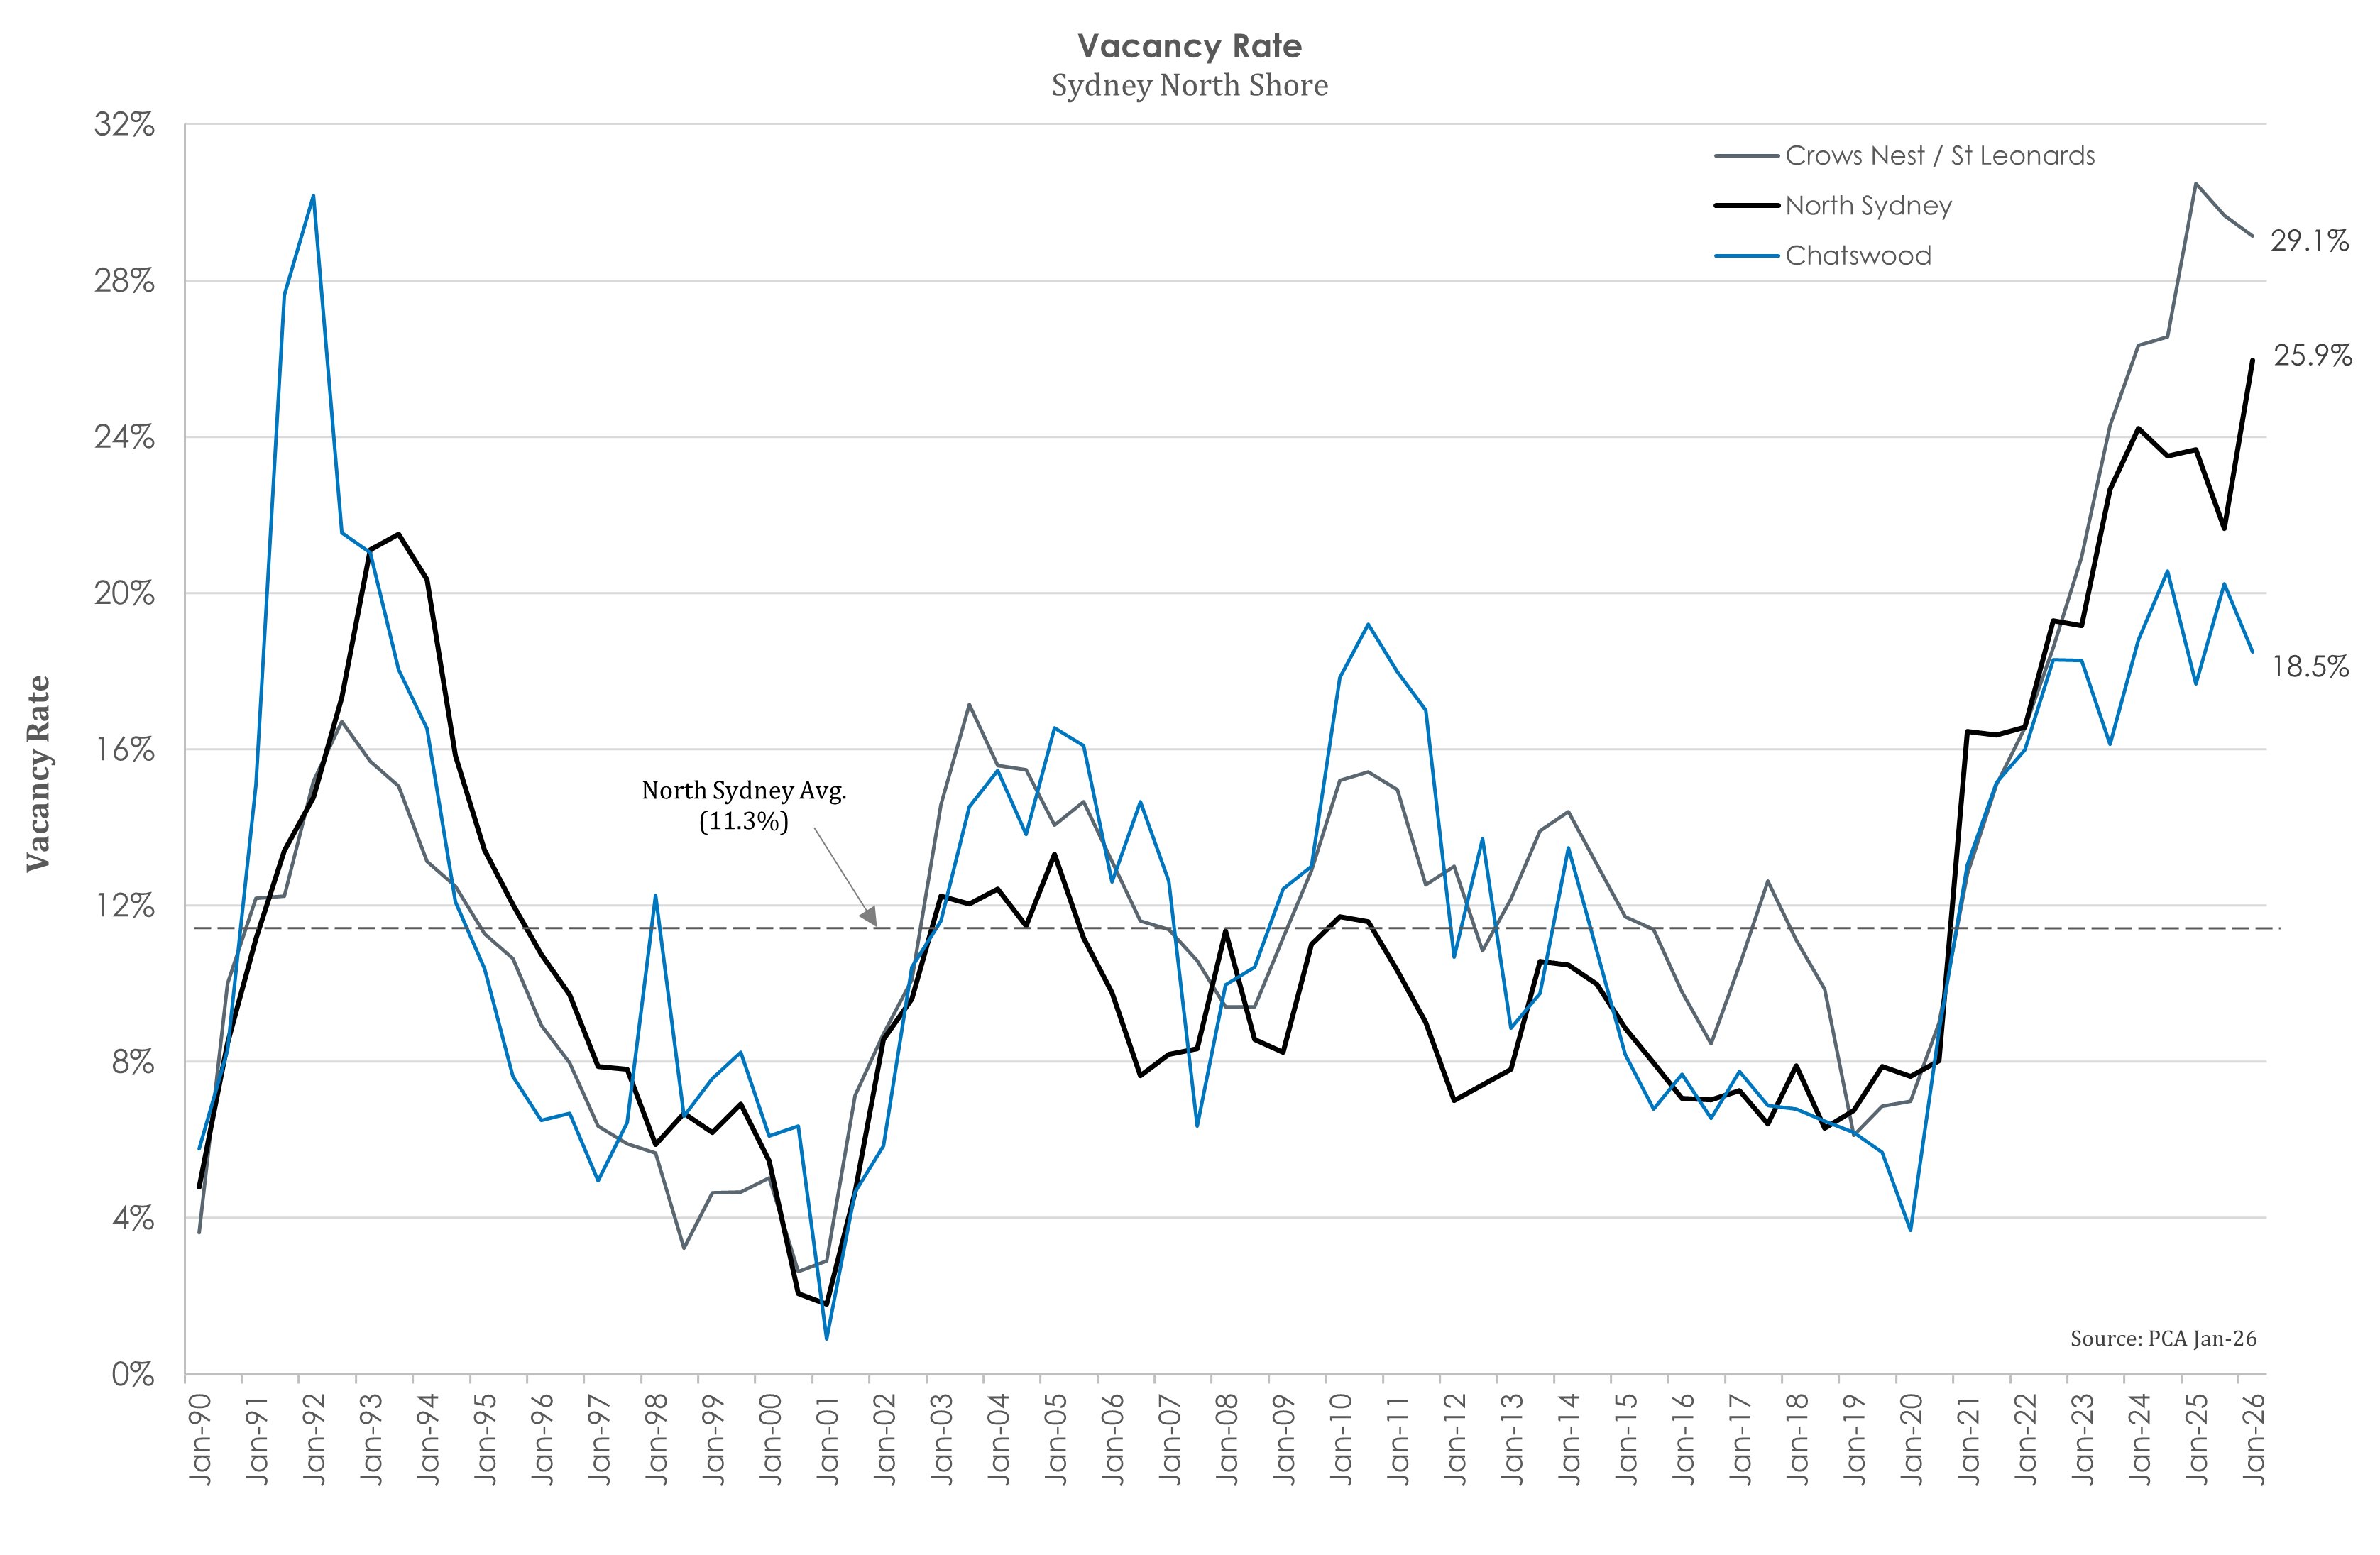
Following the completion of a partially committed Victoria Cross Tower, vacancy rates in the major North Shore market (25.4%) each rose to their respective highs (in 36 years of records). In North Sydney, mild net absorption of 1,514sqm of new supply, with the vacancy rate rising 430 basis points. In the absence of new supply, equally mild net absorption in Chatswood saw the vacancy rate fall 170 basis points to 18.5%. Chatswood has had the lowest vacancy rate on the North Shore since January, 2022 albeit the smallest precinct (accounting for 17% of total stock).
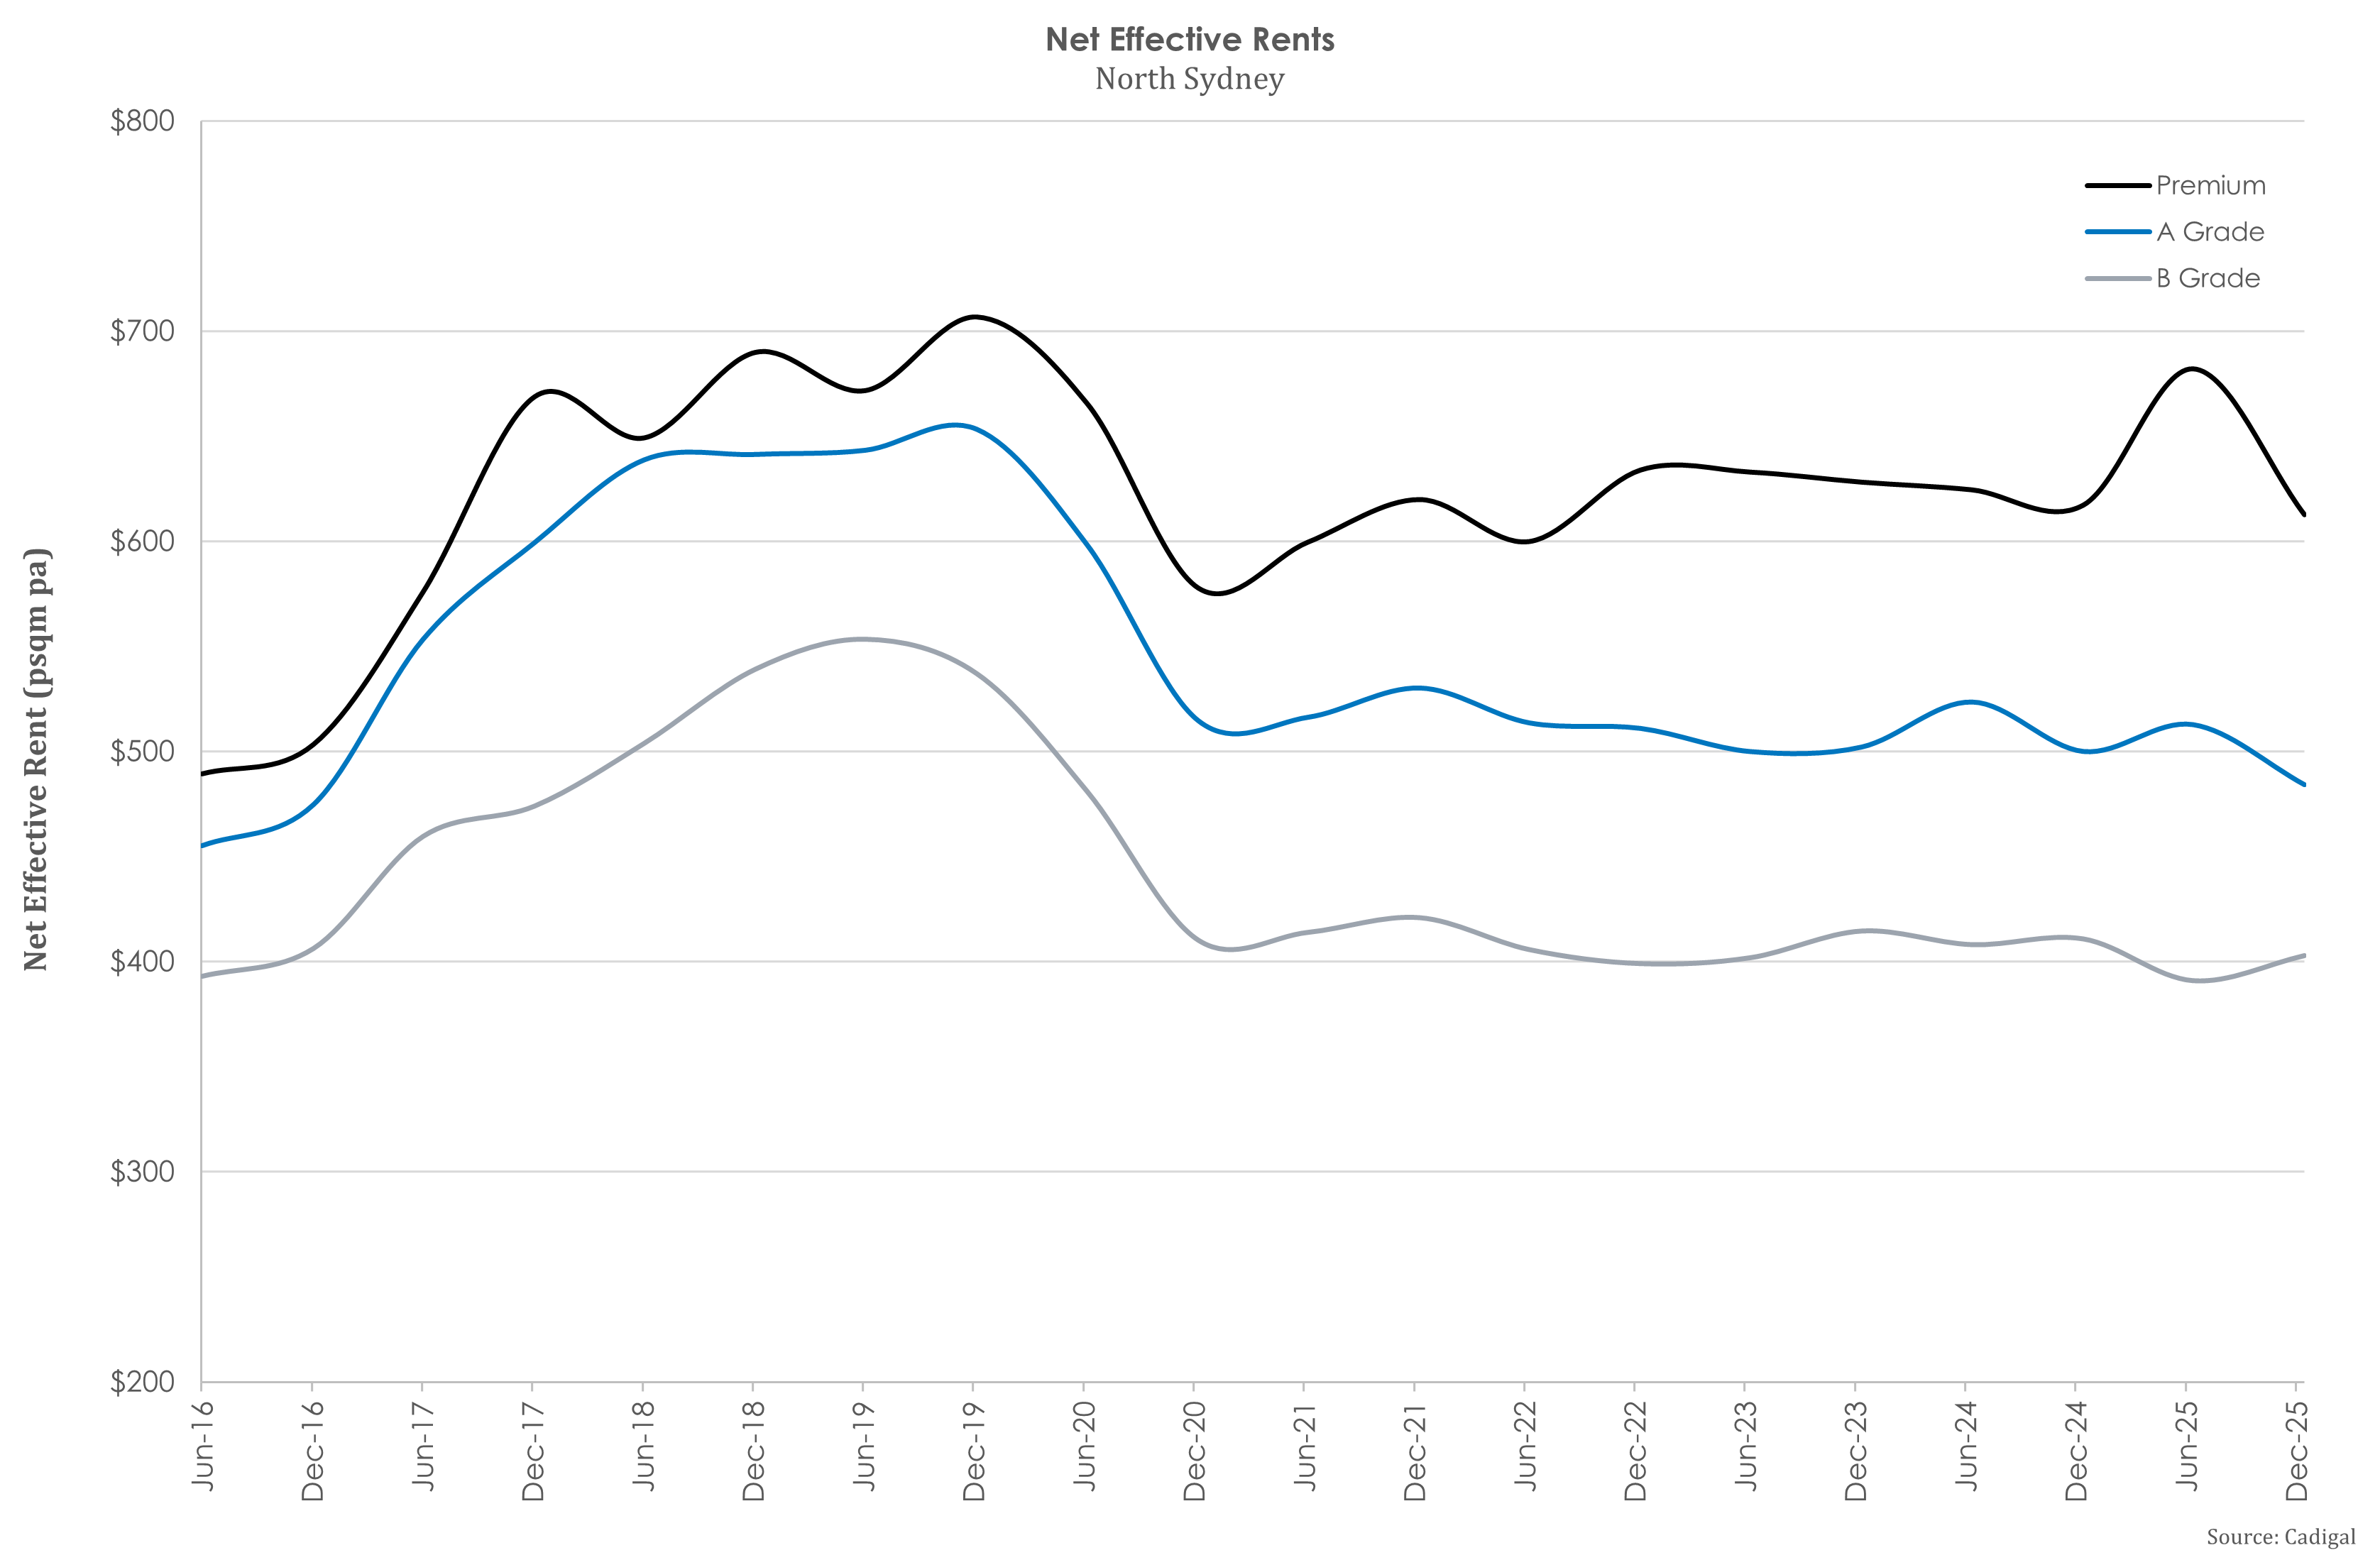
Rents
Face rental growth continued across the North Shore over 2025 with 12-month growth between 4.2% and 7.0%. Growth was stronger in North Sydney, followed by Crows Nest / St Leonards and then Chatswood. Across building grades, growth was led by Premium rents followed by A grade with B grade marginally lower.
Net Absorption
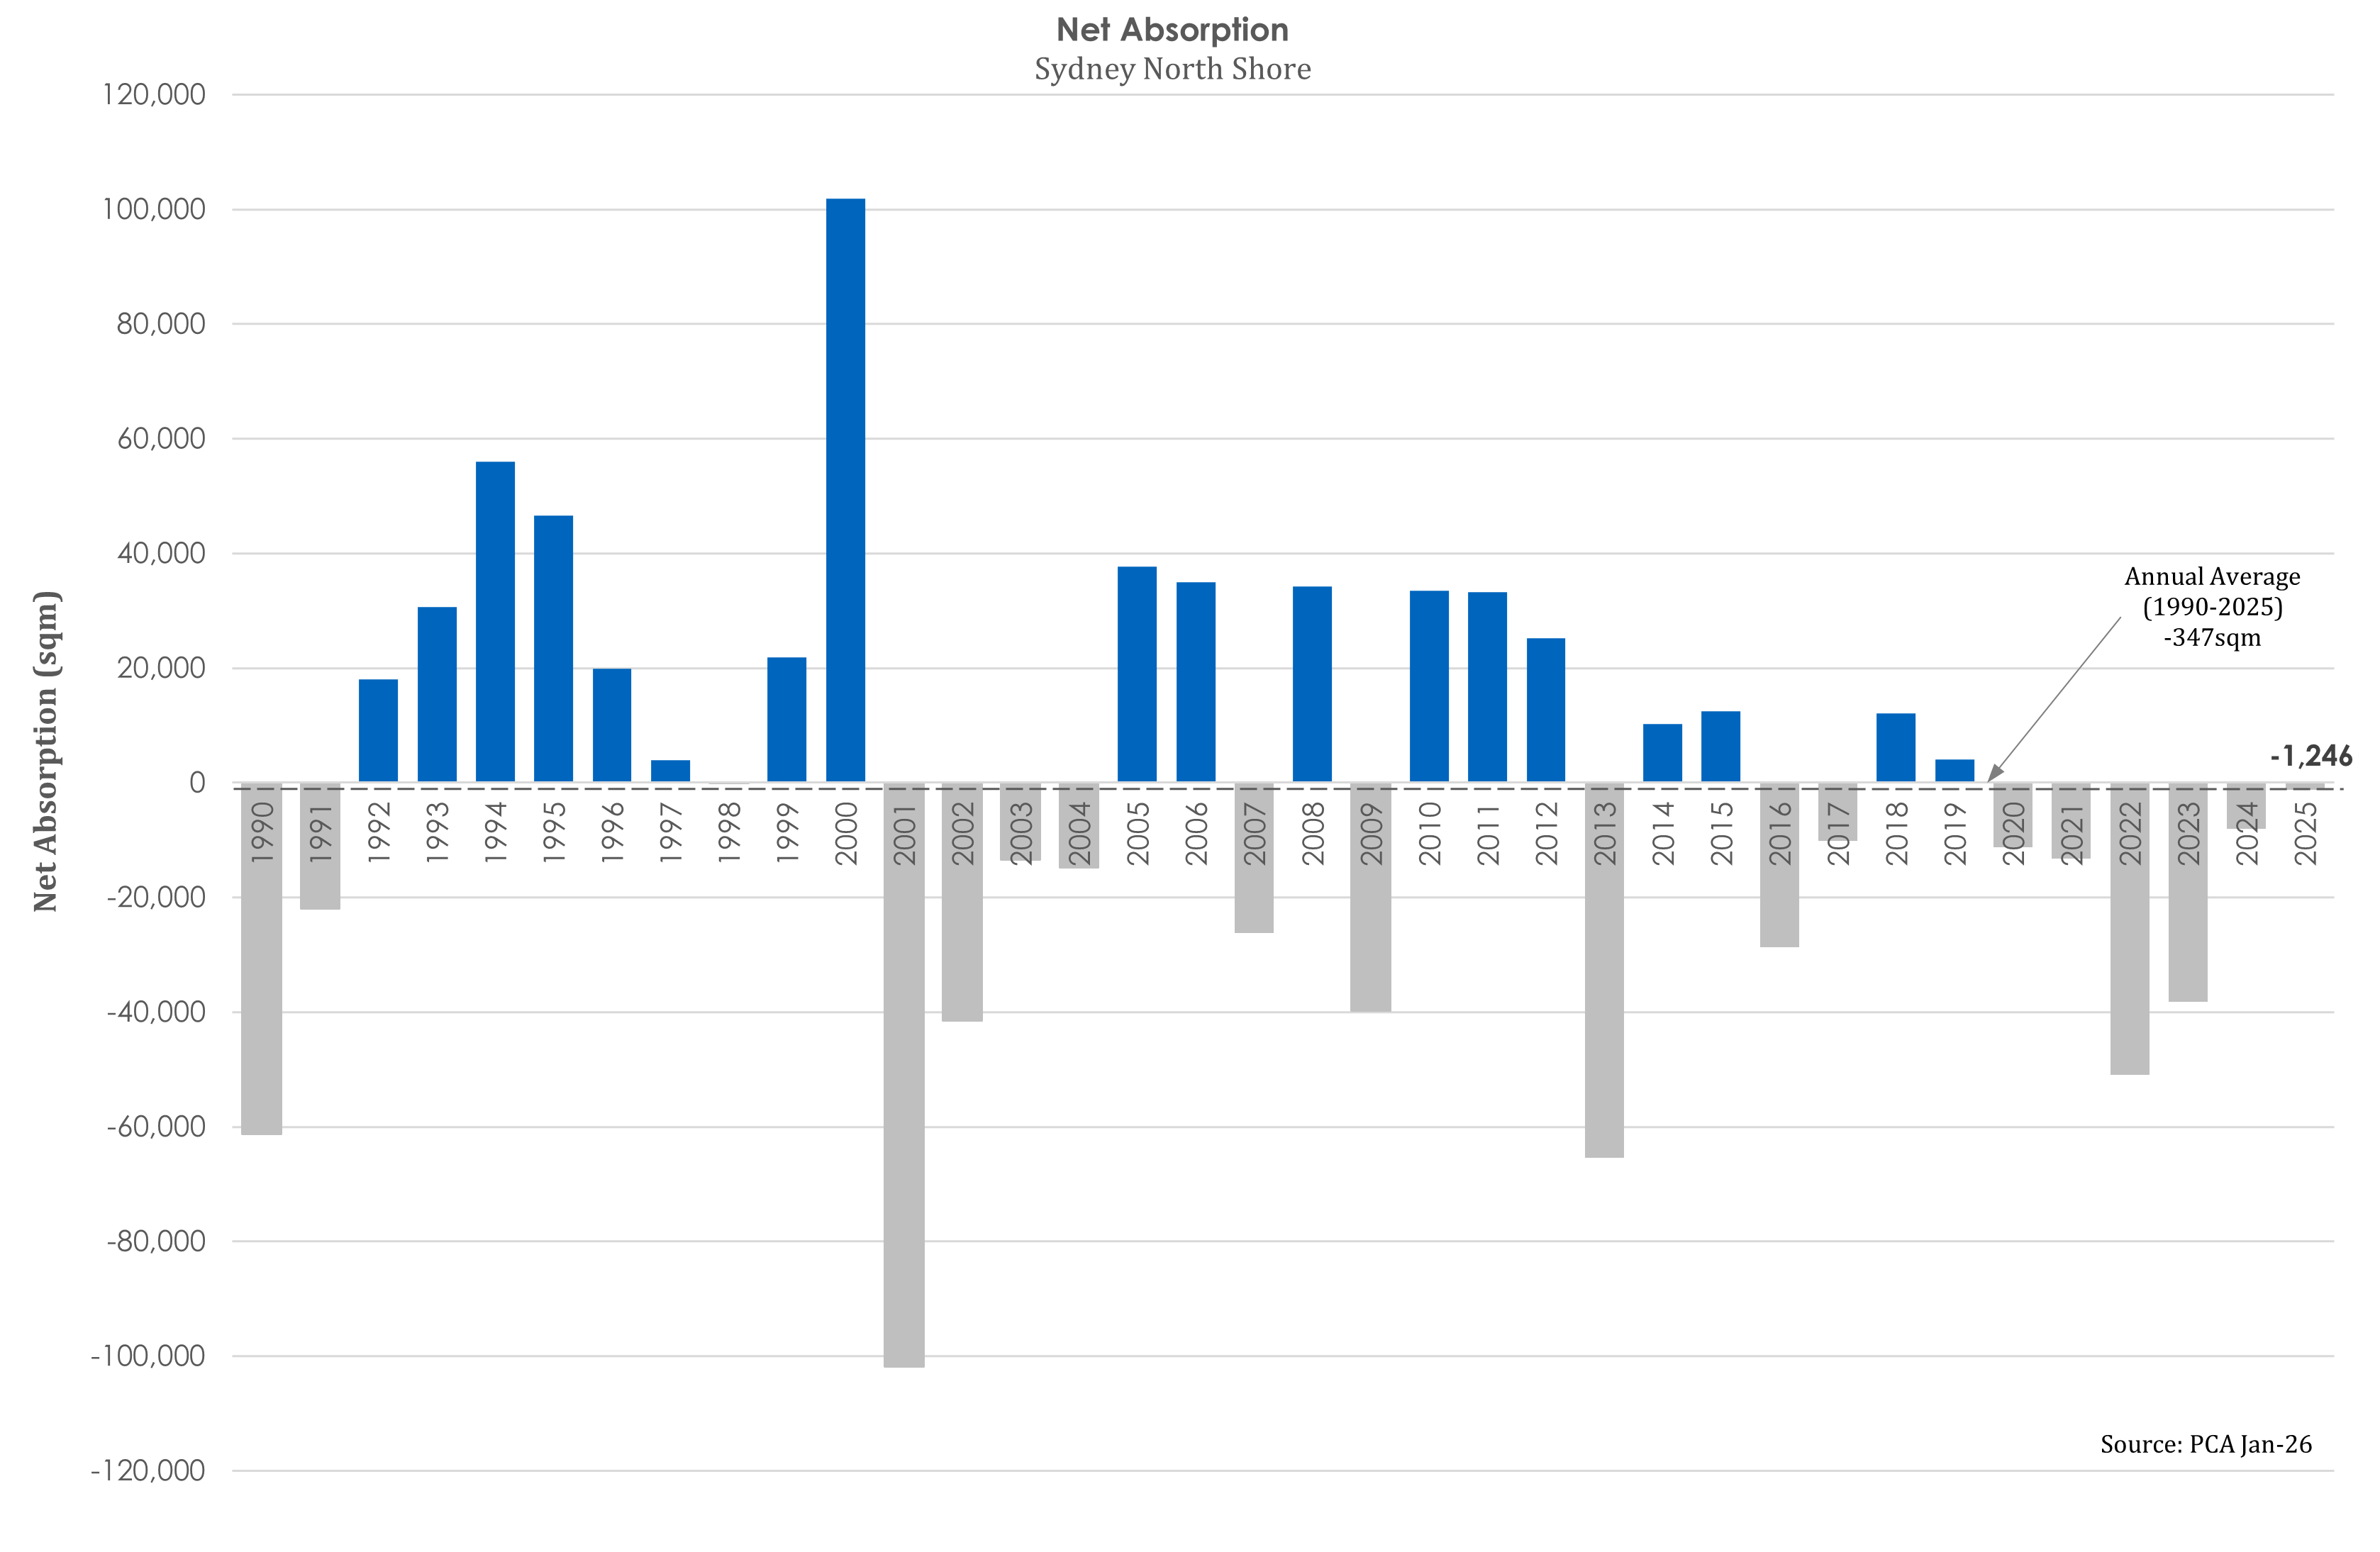
Positive net absorption of 8,030sqm was recorded across the North Shore over H2, 2025, the highest six-month total since H2, 2020. Additionally, each of the three precincts (North Sydney, Crows Nest / St Leonards and Chatswood) tallied positive net absorption, for the first time since H1, 2018. Although the H2, 2025, total was positive, it wasn't enough to cancel out the H1, 2025, result leading to a slightly negative total (-1,246sqm) for the year.
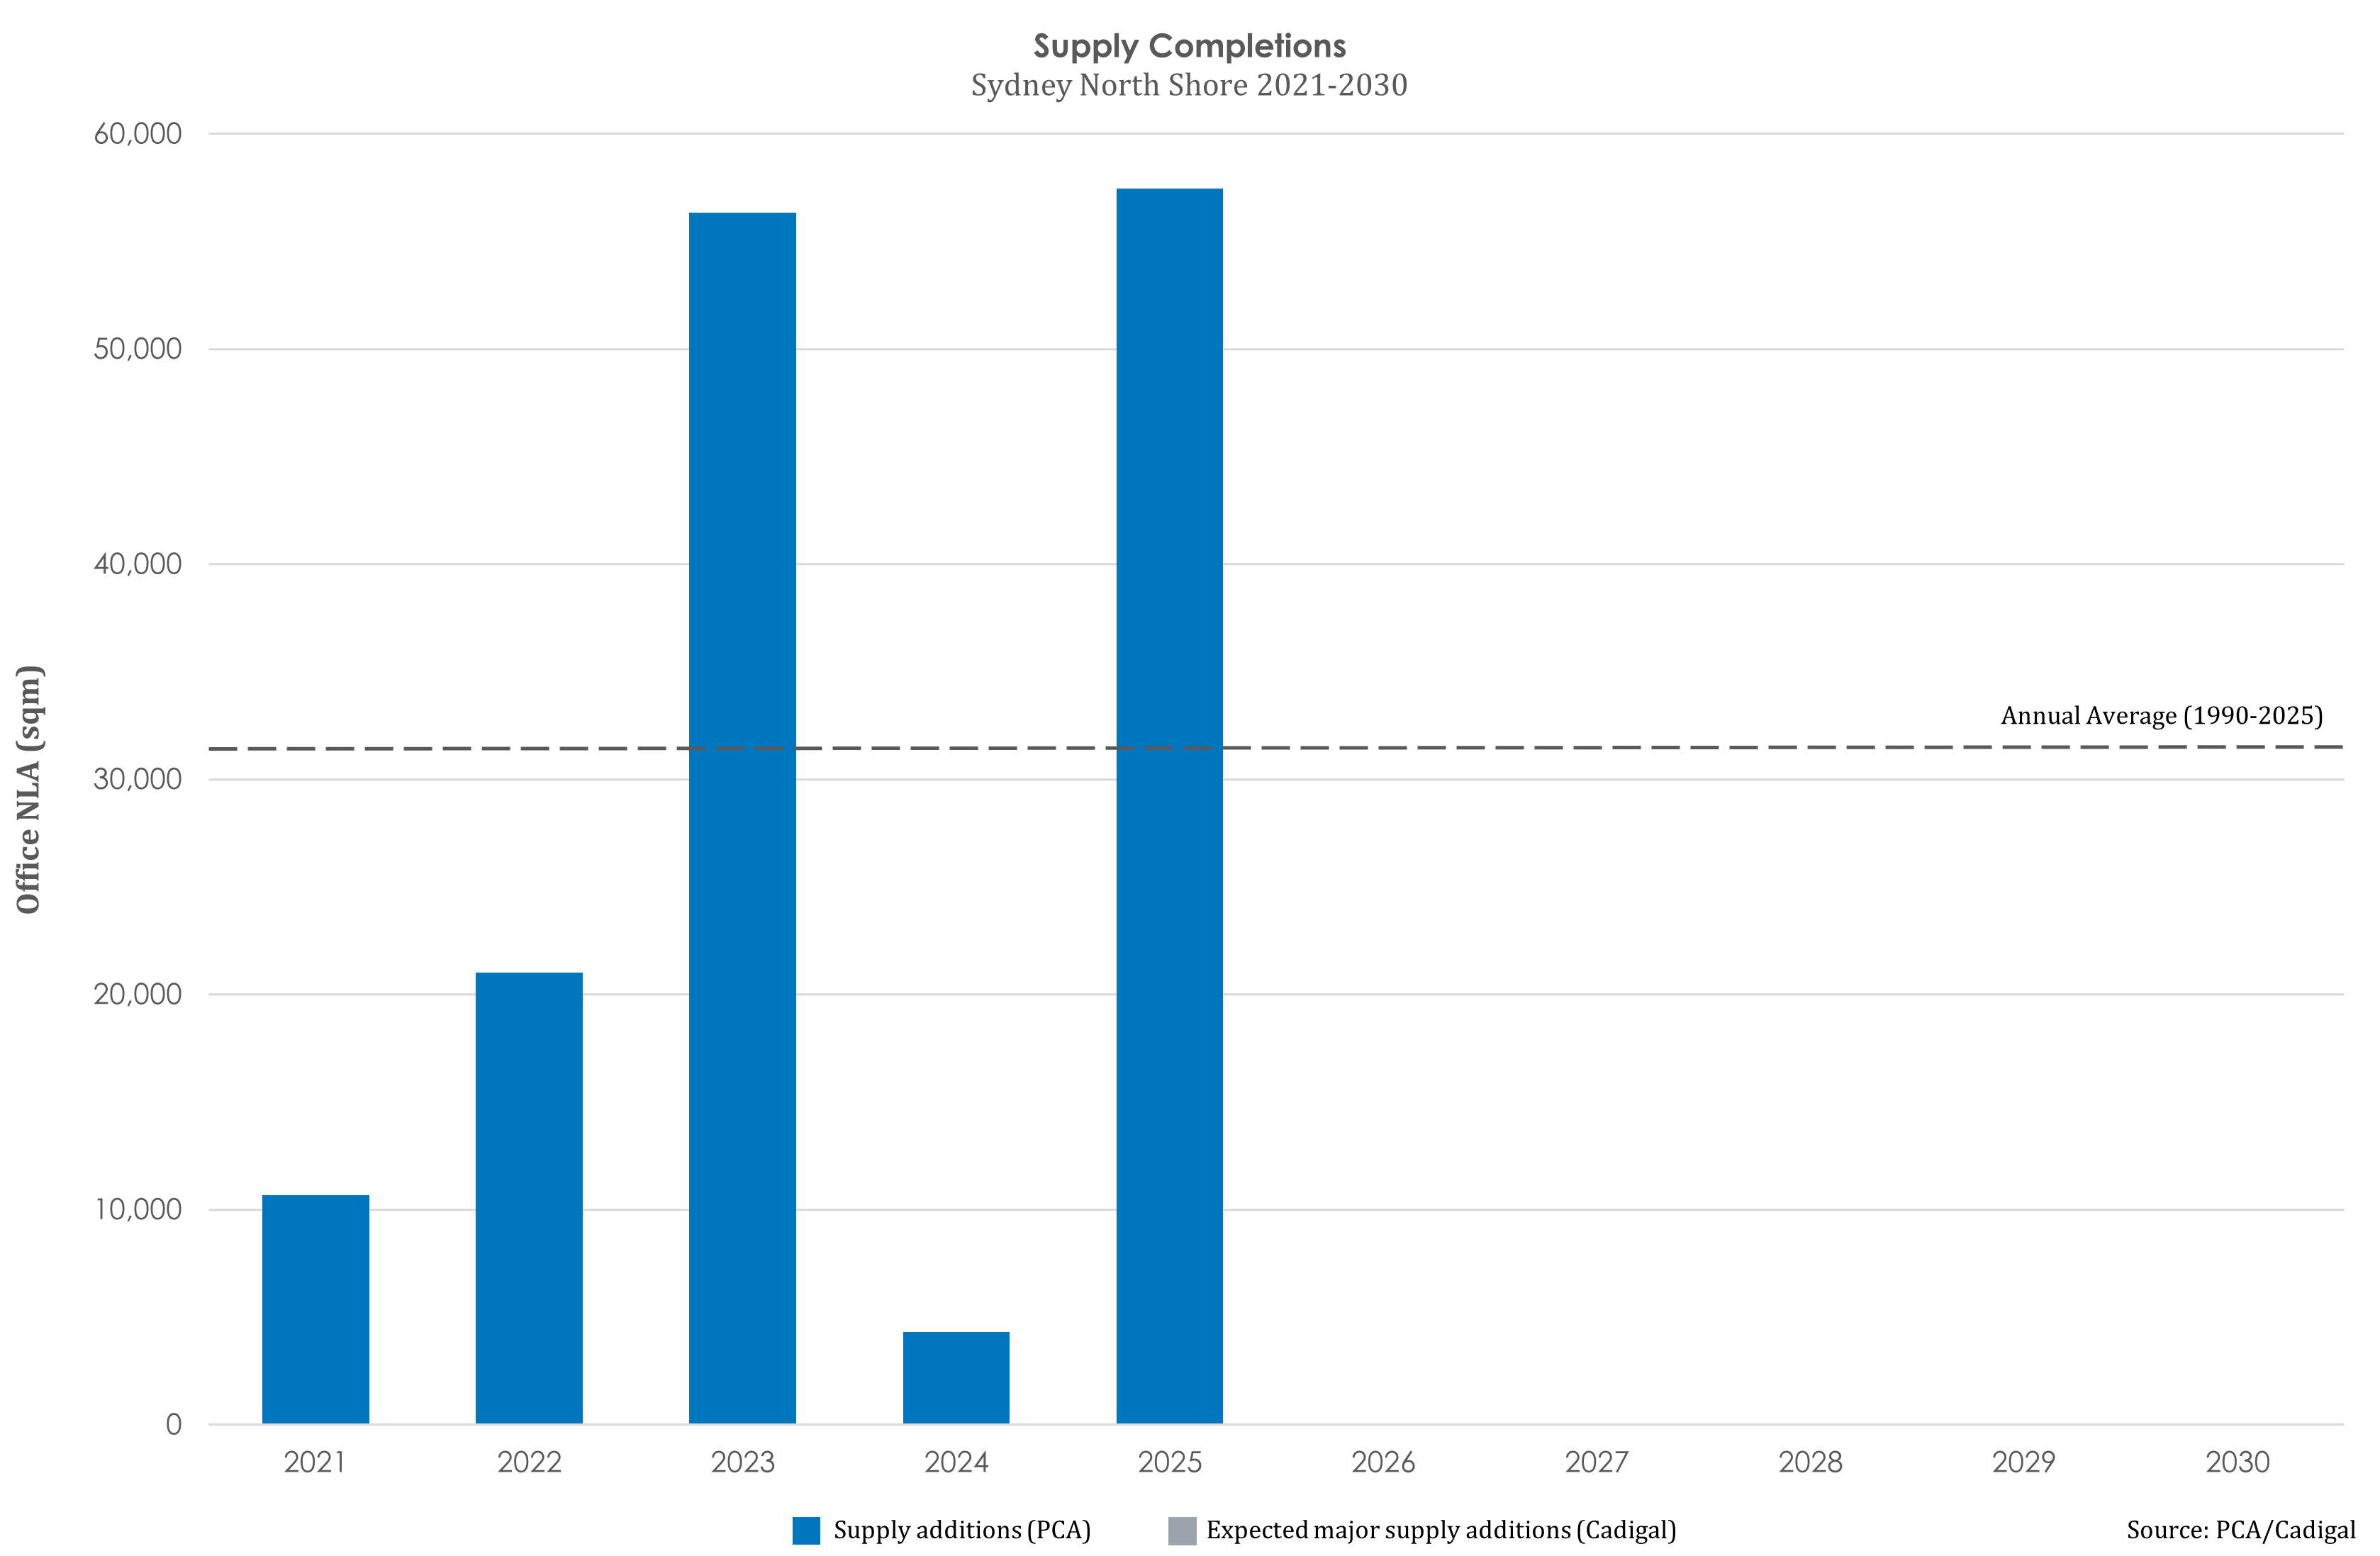
Supply
Victoria Cross Tower in North Sydney (55,315sqm office NLA), the only major office development under construction on the North Shore, was completed in Q4, 2025. With no office projects remaining under construction and no commencements expected in 2026, the market is not expected to see new office supply until 2029, at the earliest.
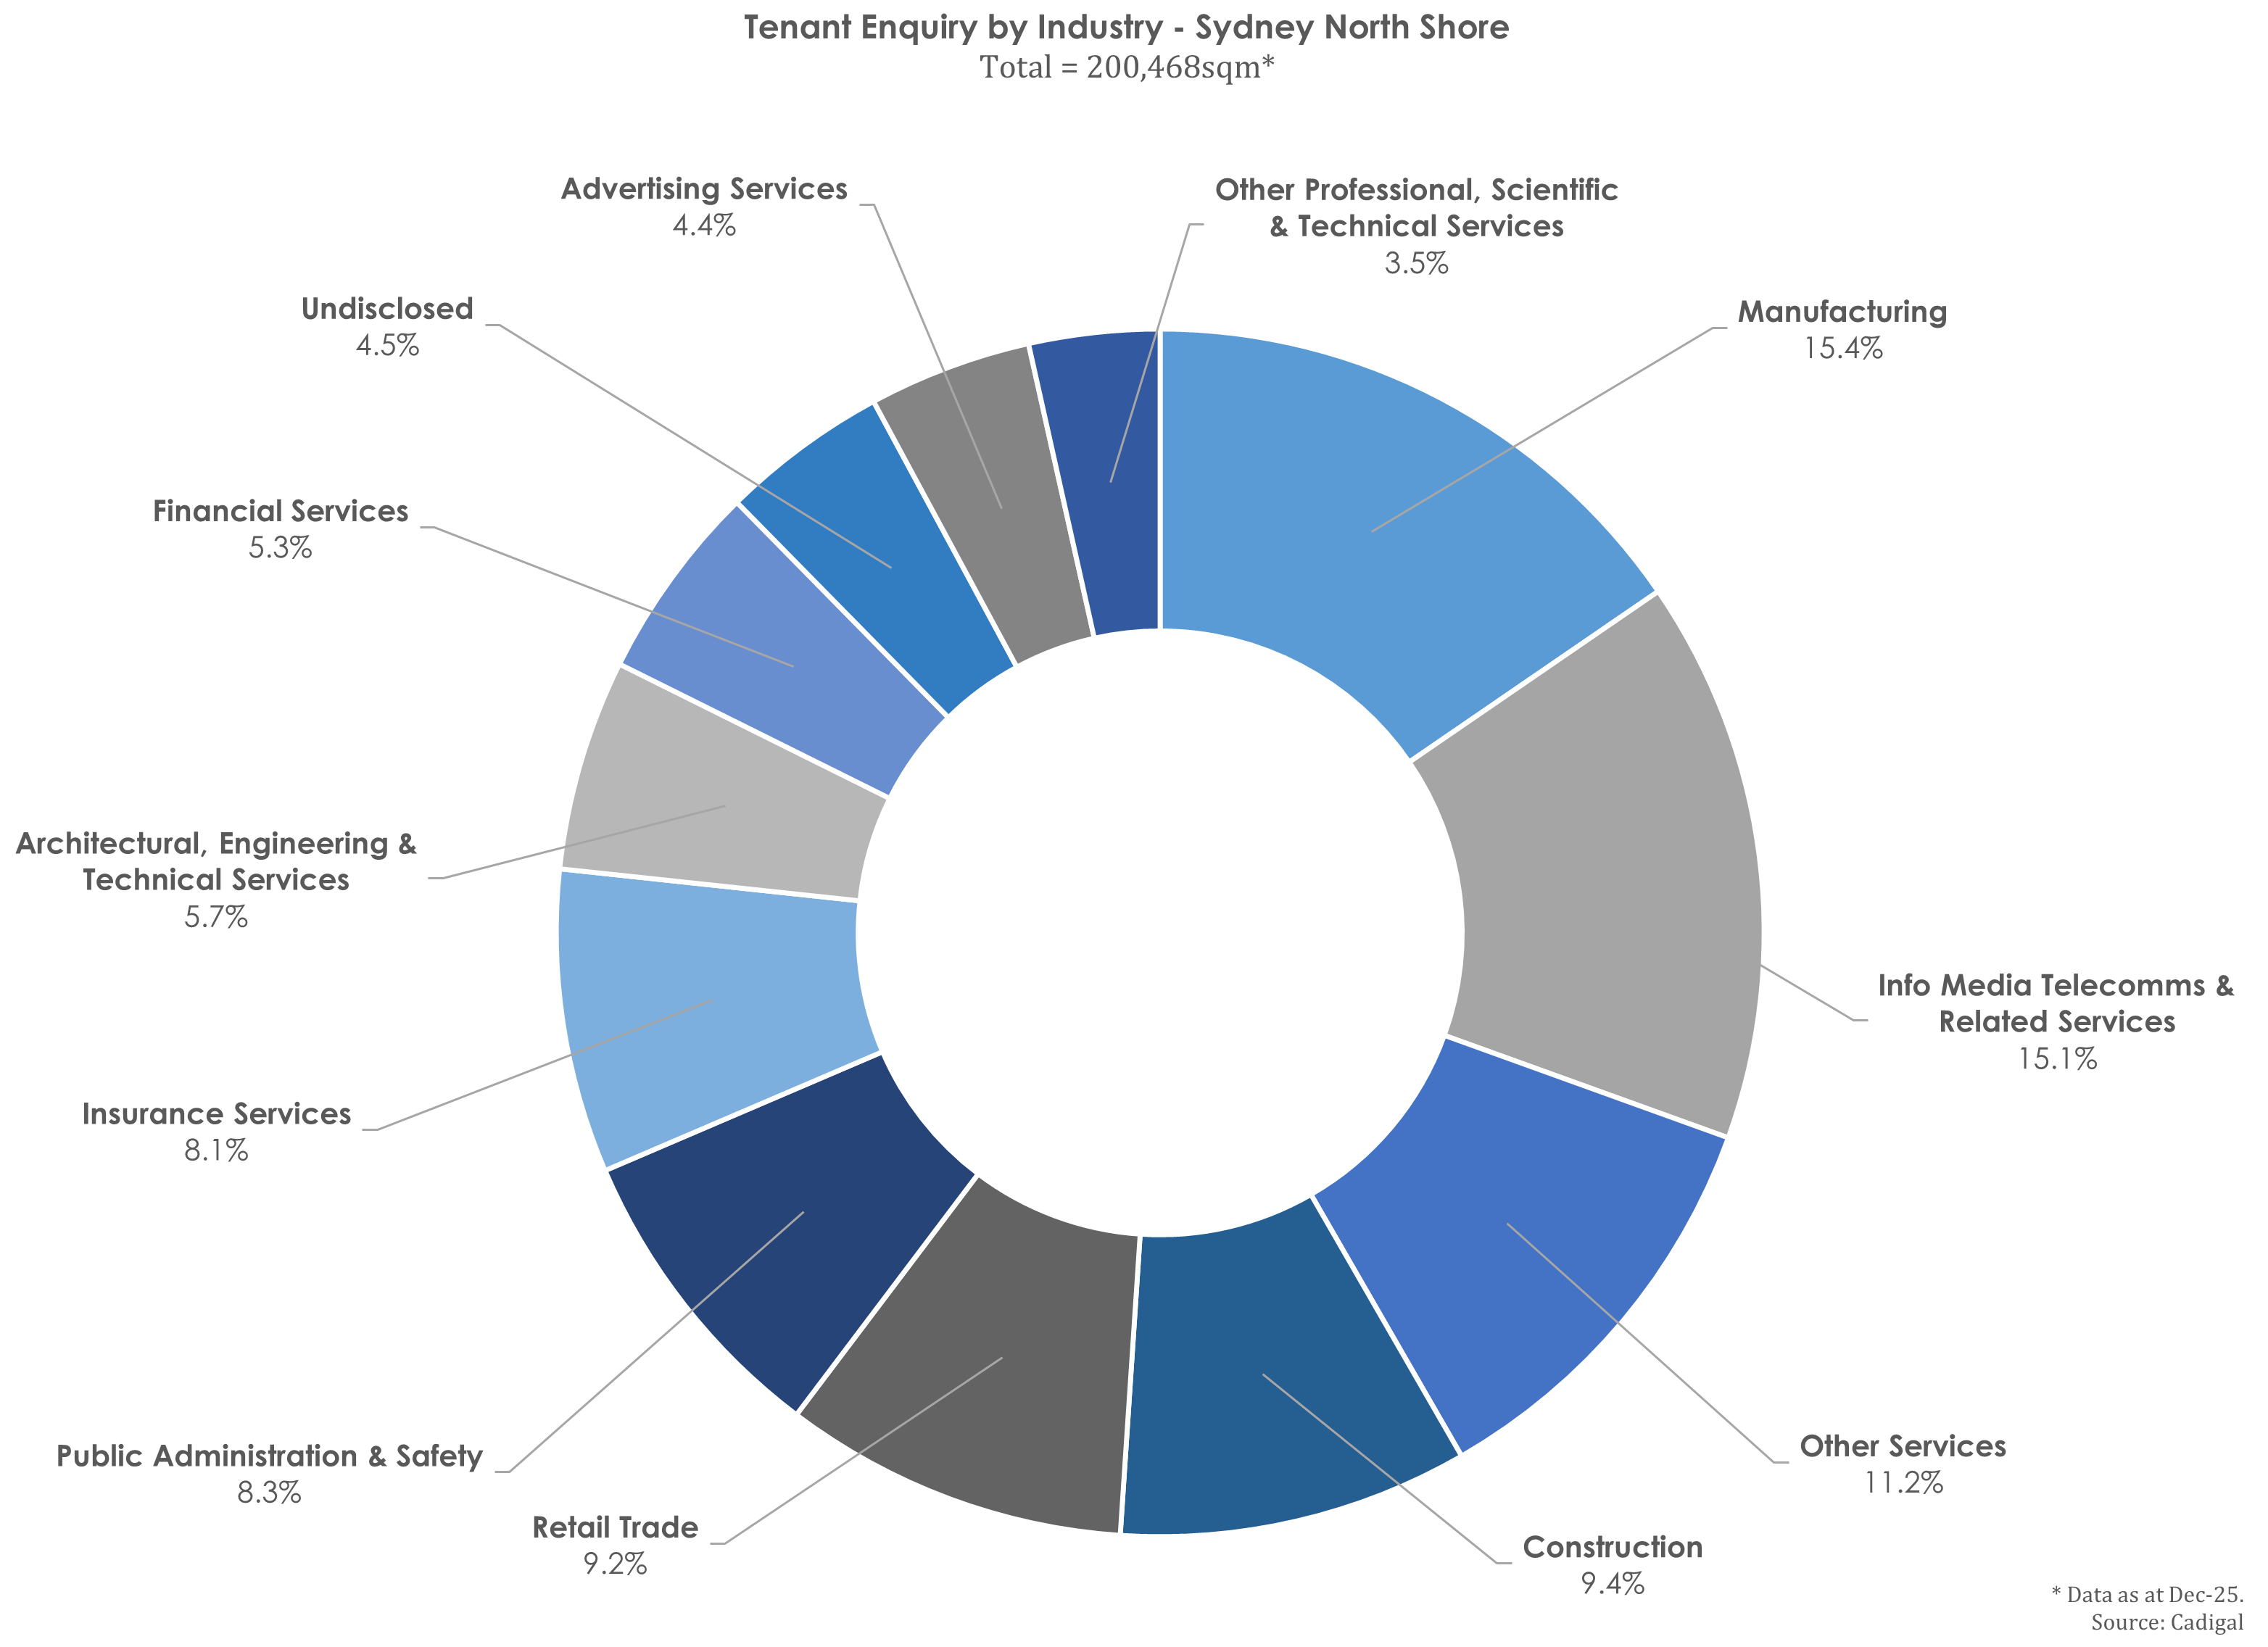
Tenant Enquiry
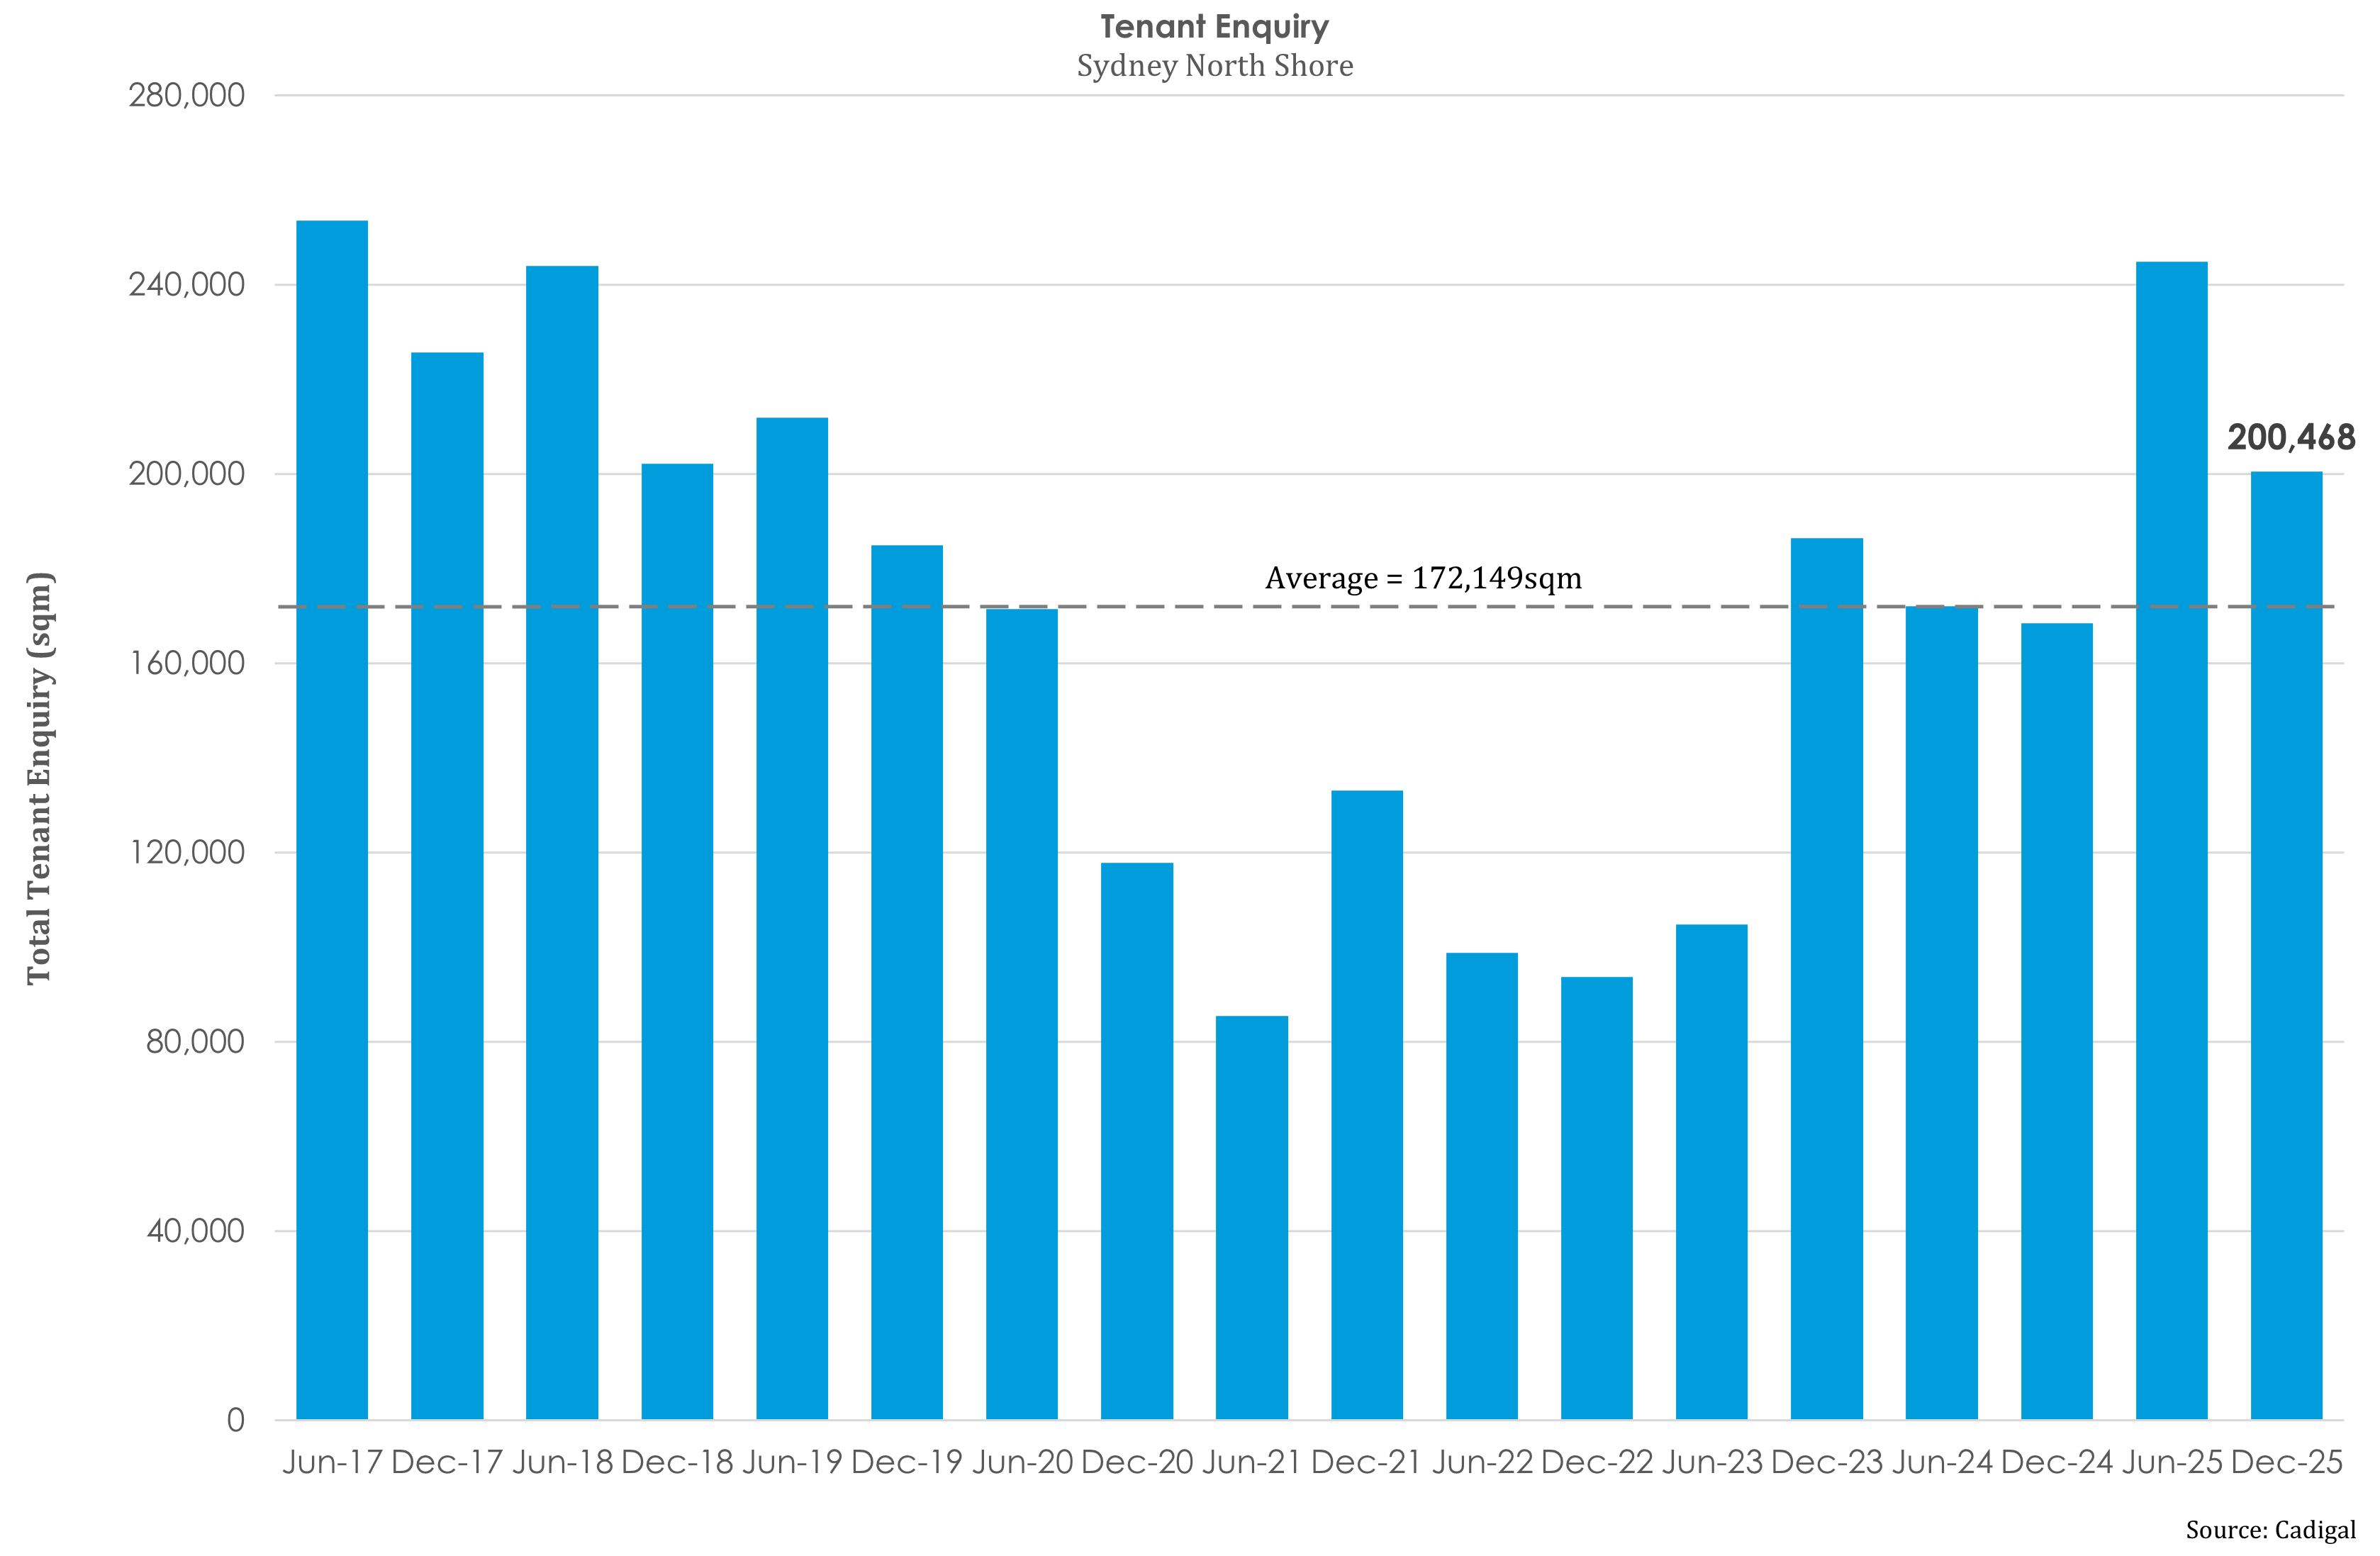
Active tenant enquiry for the North Shore remained above the 8-year average (of 172,149sqm) over H2 2025, despite falling 18% (or 44,347sqm) to 200,468sqm. Total enquiry was comprised of 160 requirements, the most in 8 years.
Enquiry by Industry